| | | | ☐ | | Preliminary Proxy Statement | | | ☐ | | Confidential, for Use of the Commission Only (as permitted by Rule 14a-6(e)(2)) | | | ☒ | | Definitive Proxy Statement | | | ☐ | | Definitive Additional Materials | | | ☐ | | Soliciting Material under § 240.14a-12 |
STANDEX INTERNATIONAL CORPORATION (Name of Registrant as Specified In Its Charter) (Name of Person(s) Filing Proxy Statement, if other than the Registrant) Payment of Filing Fee (Check the appropriate box): | | | | | | | ☒ | | No fee required. | | | ☐ | | Fee computed on table below per Exchange Act Rules 14a-6(i)(1) and 0-11. | | | | | | (1) | | Title of each class of securities to which transaction applies:
| | | (2) | ☐ | Aggregate number of securities to which transaction applies:
| | | (3) | | Per unit price or other underlying value of transaction computed pursuant to Exchange Act Rule 0-11 (set forth the amount on which the filing fee is calculated and state how it was determined):
| | | (4) | | Proposed maximum aggregate value of transaction:
| | | (5) | | Total fee paid:
| | | ☐ | | Fee paid previously with preliminary materials. | | | ☐ | | Check box if any part of the fee is offset as provided by Exchange Act Rule 0-11(a)(2) and identify the filing for which the offsetting fee was paid previously. Identify the previous filing by registration statement number, or the Form or Schedule and the date of its filing. | | | | | | (1) | | Amount Previously Paid:
| | | (2) | ☐ | Form, Schedule or Registration Statement No.:Fee computed on table in exhibit required by Item 25(b) per Exchange Act Rules 14-6(i)(1) and 0-11.
|
 Guide to Standex’s Proxy Statement Invitation to 2023 Annual Meeting of Shareholders | 3 | | | (3) | Notice of Annual Meeting of Shareholders | Filing Party:4
| | | (4) | | Date Filed:
|
GUIDETO STANDEX’S PROXY STATEMENT
INVITATIONTO 2021 ANNUAL MEETINGOF SHAREHOLDERSInvitation to 2023 Annual Meeting of Shareholders
Tuesday, October 26, 202124, 2023 9:00 a.m., local time Standex International Corporation Corporate Headquarters 23 Keewaydin Drive, Suite 300, Salem, New Hampshire 03079*03079 Dear Shareholder, We cordially invite you to attend Standex’s Annual Meeting of Shareholders. We hope that you will join me, our Board of Directors, and other shareholders at the meeting. The attached Notice of Annual Meeting of Shareholders and Proxy Statement contain information about the business that will be conducted at the meeting. Following the meeting, I will present information on Standex’s operations and welcome any questions from shareholders. Your vote is important to us! If you plan on attending the meeting, you may vote your shares in person. If you cannot vote in person, we urge you to vote via your proxy card, over the phone or on the Internet prior to the meeting. Detailed instructions on how to vote are found onpage 7369. Thank you in advance for voting your shares, and thank you for your continued support of Standex. Sincerely, | | |  
David Dunbar President/CEO Chair, Board of Directors | | 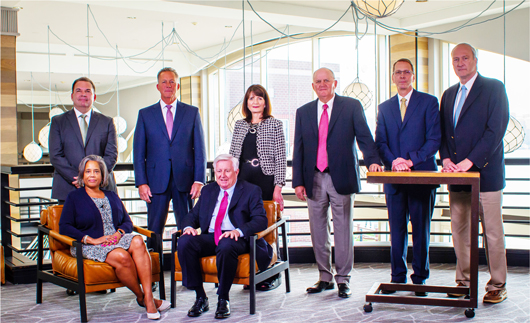 
Standing from left to right: Jeffrey S. Edwards, Michael A. Hickey, Robin J. Davenport, (nominee for election to the Board), Charles H. Cannon, Jr., David Dunbar, and Thomas E. Chorman. Seated from left to right:B. Joanne Edwards and Thomas J. Hansen. |
* | Our Annual Meeting will follow all COVID-19 public health protocols, including keeping attendees at social distance and requiring all attendees to wear face coverings, which will be provided. In the unlikely event that we are not able to hold the Annual Meeting in person, we will notify all shareholders, through a press release and at www.envisionreports.com/sxi, regarding an alternative location or remote access.
|
NOTICEOF ANNUAL MEETINGOFNotice of Annual Meeting of
SHAREHOLDERSShareholders
The 20212023 Annual Meeting of Shareholders (the “Annual Meeting”) of Standex International Corporation (the “Company” or “Standex”) will be held on Tuesday, October 26, 202124, 2023 at 9:00 a.m., local time, at the Company’s Corporate Headquarters, located at 23 Keewaydin Drive, Suite 300, Salem, New Hampshire 03079.* You are receiving these proxy materials in connection with the solicitation of proxies by the Board of Directors (the “Board”) of Standex, a Delaware corporation, to be voted at the 20212023 Annual Meeting and any continuation, adjournment or postponement thereof. Shareholders of record at the close of business on August 31, 20212023 are entitled to vote at the meeting, either in person or by proxy, on the following matters, as well as the transaction of any other business properly presented at the Annual Meeting: 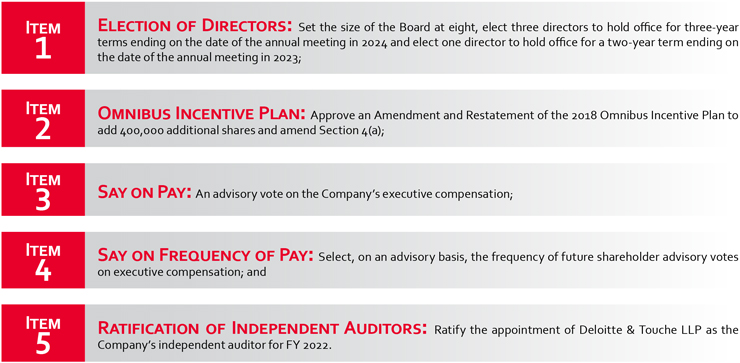
On September 10, 2021, we began to mail our shareholders either a notice containing instructions on how to access this Proxy Statement and our Annual Report through the Internet, or a printed copy of these materials. We have provided each shareholder with a Notice of Internet Availability of Proxy Materials (the “Notice”), which encourages shareholders to review all proxy materials and our annual report and vote online at www.envisionreports.com/sxi. We believe that reviewing materials online reduces our costs, eliminates surplus printed materials and generally reduces the environmental impact of our Annual Meeting. If you would like to receive a printed copy of our proxy materials, please follow the instructions contained in the Notice.
All proxy solicitation costs are paid by the Company. In addition to proxy solicitations made by mail, the Company’s directors and officers may solicit proxies in person or by telephone.
Your vote is important. Whether or not you plan to attend the Annual Meeting, we hope that you will vote your shares as soon as possible. We encourage you to vote via the Internet, since it is convenient and significantly reduces postage and processing costs. You may also vote via telephone or by mail if you received paper copies of the proxy materials. Instructions regarding the methods of voting are included in the Notice, the proxy card and this Proxy Statement on page 73.
By Order of the Board of Directors,

Alan J. Glass, Secretary
Item 1 | | Election of Directors: Elect three directors to hold office for three-year terms ending on the date of the annual meeting in 2026; | | | | Item 2 | Say on Pay: An advisory vote on the Company’s executive compensation; | | | Item 3 | Ratification of Independent Auditors: Ratify the appointment of Deloitte & Touche LLP as the Company’s independent auditors for FY 2024. |
On September 8, 2023, we began to mail our shareholders either a notice containing instructions on how to access this Proxy Statement and our Annual Report through the Internet, or a printed copy of these materials. We have provided each shareholder with a Notice of Internet Availability of Proxy Materials (the “Notice”), which encourages shareholders to review all proxy materials and our annual report and vote online at www.envisionreports.com/sxi. We believe that reviewing materials online reduces our costs, eliminates surplus printed materials and generally reduces the environmental impact of our Annual Meeting. If you would like to receive a printed copy of our proxy materials, please follow the instructions contained in the Notice. All proxy solicitation costs are paid by the Company. In addition to proxy solicitations made by mail, the Company’s directors and officers may solicit proxies in person or by telephone. | Your vote is important. Whether or not you plan to attend the Annual Meeting, we hope that you will vote your shares as soon as possible. We encourage you to vote via the Internet, since it is convenient and significantly reduces postage and processing costs. You may also vote via telephone or by mail if you received paper copies of the proxy materials. Instructions regarding the methods of voting are included in the Notice, the proxy card and this Proxy Statement on page 69. By Order of the Board of Directors, 
Alan Glass, Secretary |
IMPORTANT NOTICE REGARDING THE AVAILABILITY OF PROXY MATERIALS FOR THE SHAREHOLDER MEETING TO BE HELD ON OCTOBER 26, 2021.24, 2023 | | As permitted by the SEC, the 20212023 Notice of Annual Meeting of Shareholders and Proxy Statement and the 20212023 Annual Report on Form 10-K are available for review at ir.standex.com by clicking “Financials” and then “Annual Reports.” |
* | Our Annual Meeting will follow all COVID-19 public health protocols, including keeping attendees at social distance and requiring all attendees to wear face coverings, which will be provided. In the unlikely event that we are not able to hold the Annual Meeting in person, we will notify all shareholders, through a press release and at www.envisionreports.com/sxi, regarding an alternative location or remote access.
|
PROXY STATEMENT SUMMARYProxy Statement Summary
This summary contains a general overview of this Proxy Statement. It highlights information contained elsewhere in this Proxy Statement and is meant to be used as a quick reference. This summary does NOT contain all of the information that you should consider before voting. You should read the entire Proxy Statement carefully before voting. | | | 2021 ANNUAL MEETING2023 Annual Meeting | | |

You are receiving these proxy materials in connection with the solicitation of proxies by the Board of Directors of Standex International Corporation, a Delaware corporation, to be voted at the 20212023 Annual Meeting and any continuation, adjournment or postponement thereof. On September 10, 2021,8, 2023, we began to mail our shareholders either a notice containing instructions on how to access this Proxy Statement and our Annual Report through the Internet, or a printed copy of these materials. The Notice explains how you may access and review the proxy materials and how you may submit your proxy via the Internet. If you would like to receive a printed copy of our proxy materials, please follow the instructions contained in the Notice. All proxy solicitation costs are paid by the Company. In addition to proxy solicitations made by mail, the Company’s directors and officers may solicit proxies in person or by telephone. | | | AGENDAAND VOTING RECOMMENDATIONSAgenda and Voting Recommendations | | |
| | | | | Item | | Proposals | | Board Vote Recommendation | 1 | | Election of Directors | | FOR | 2 | | Amended and Restated Omnibus Incentive Plan
| | FOR
| 3
| | Advisory Vote on Executive Compensation | | FOR | 43
| | Advisory Vote on Frequency of Say on Pay
| | FOR “One Year”
| 5
| | Ratification of Auditors | | FOR |
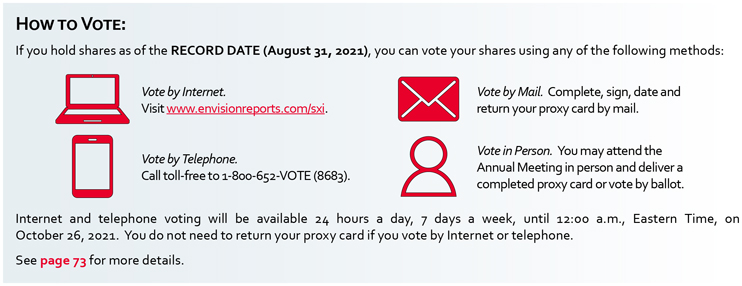
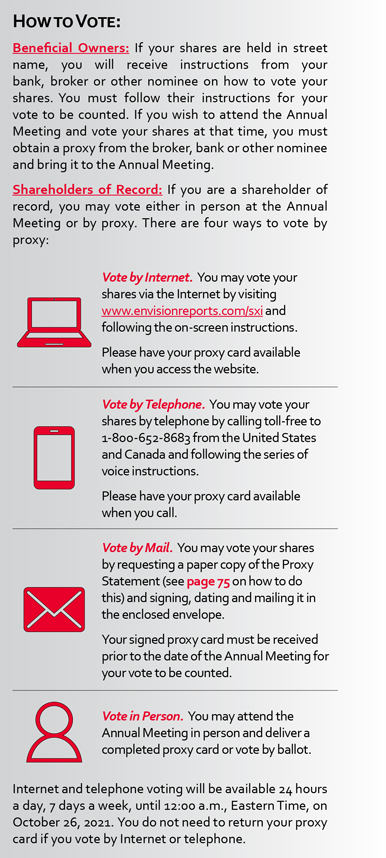
 | Vote by Internet.
Visit www.envisionreports.com/sxi. |  | | Vote by Mail. Complete, sign, date and return your proxy card by mail. | 6 | Vote by Telephone.
Call toll-free to 1-800-652-VOTE (8683). | 2021 PROXY STATEMENT | | Vote in Person. You may attend the Annual Meeting in person and deliver a completed proxy card or vote by ballot. |
Internet and telephone voting will be available 24 hours a day, 7 days a week, until 1:00 a.m., Eastern Time, on October 24, 2023. You do not need to return your proxy card if you vote by Internet or telephone.
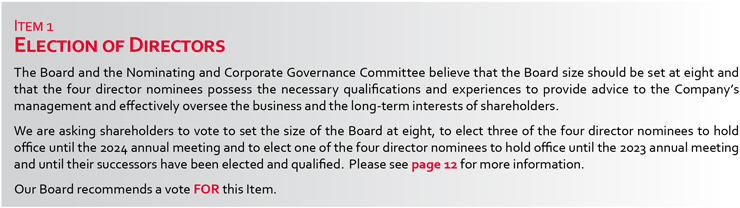
Item 1 BOARD NOMINEESElectionofDirectors
The Board and the Nominating and Corporate Governance Committee believe that the three director nominees possess the necessary qualifications and experiences to provide advice to the Company’s management and effectively oversee the business and the long-term interests of shareholders. We are asking shareholders to vote to elect three director nominees to hold office until the 2026 annual meeting and until their successors have been elected and qualified. Please see page 9for more information. Our Board recommends a vote FORthis Item. |
Board Nominees & CONTINUING DIRECTORSContinuing Directors | | |
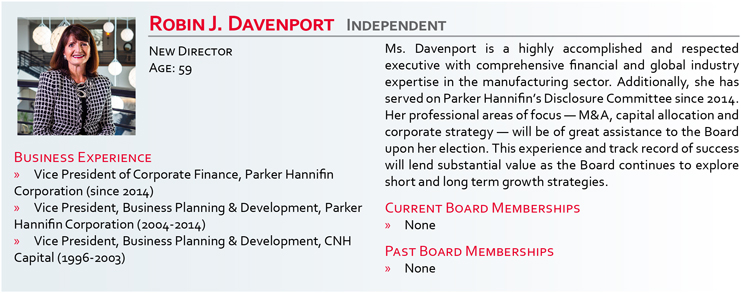
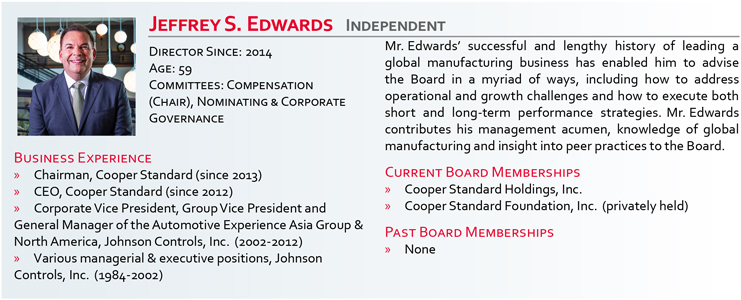
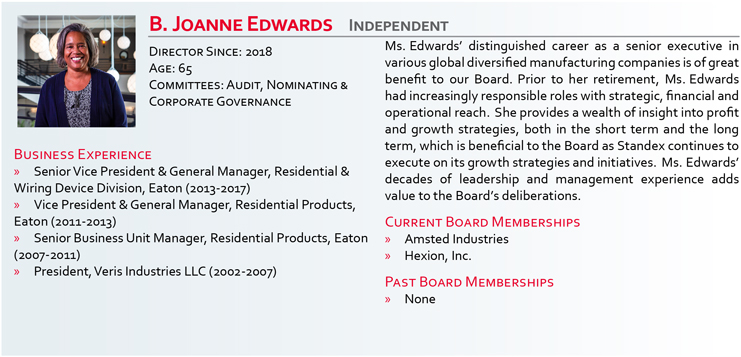
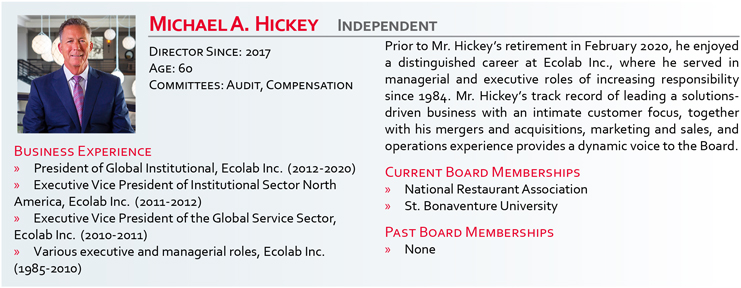
| | | | | | | | | | | | | | | | Age | | Years of Tenure | | Term Expiration | | Committee Memberships | | Name | | A | | C | | N&CG | | | | | | | | ROBIN J. DAVENPORT* INDEPENDENT Vice President of Corporate Finance, Parker Hannifin Corporation | | 59 | | 0 | | - | |  | | | | | | | | | | | | JEFFREY S. EDWARDS** INDEPENDENT Chairman and Chief Executive Officer, Cooper Standard Holdings, Inc. | | 59 | | 7 | | 2021 | | | |  | |  | | | | | | | | B. JOANNE EDWARDS** INDEPENDENT Former Senior Vice President and General Manager, Eaton Corporation Plc. | | 65 | | 3 | | 2021 | | | | | | | | | | | | | | CHARLES H. CANNON, JR. INDEPENDENT Former Executive Chairman and Chief Executive Officer, John Bean Technologies | | 69 | | 17 | | 2021 | | | | | | | | | | | | | | THOMAS E. CHORMAN INDEPENDENT Chief Executive Officer, Solar LED Innovations, LLC | | 67 | | 17 | | 2022 | | | | | | | | | | | | | | THOMAS J. HANSEN LEAD INDEPENDENT DIRECTOR Former Executive Vice Chairman, Illinois Tool Works, Inc. | | 72 | | 8 | | 2022 | | | | | | | | | | | | | | DAVID DUNBAR President and Chief Executive Officer, Standex International Corporation | | 59 | | 7 | | 2023 | | | | | | | | | | | | | | MICHAEL A. HICKEY INDEPENDENT Former Executive Vice President and President of Global Institutional, Ecolab, Inc. | | 60 | | 4 | | 2023 | | | | | | |
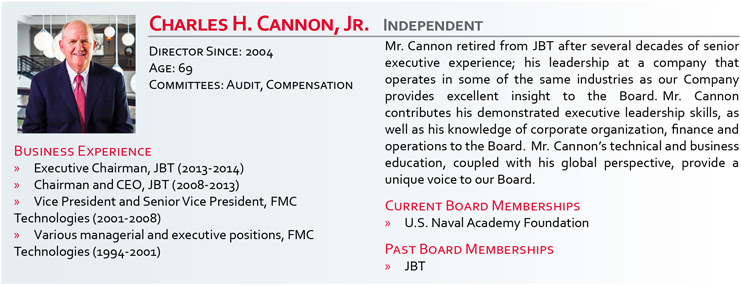
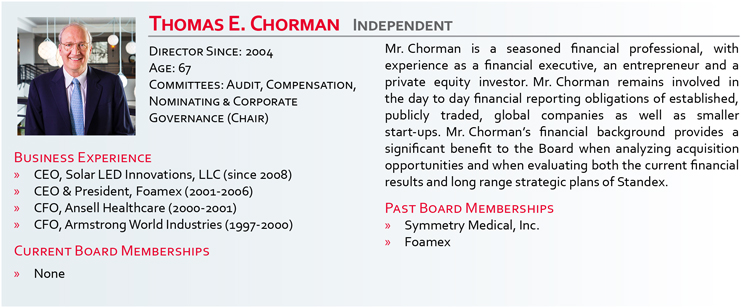
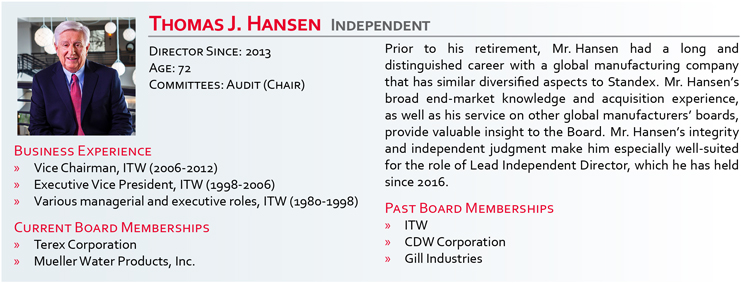
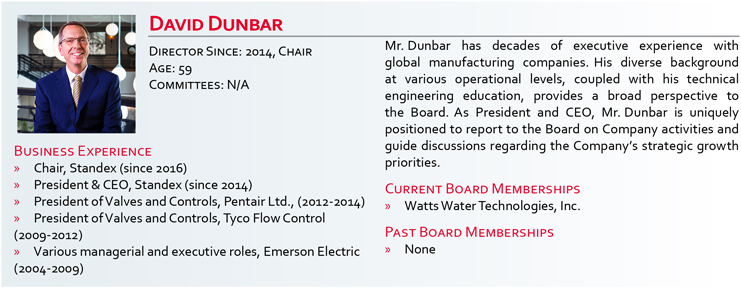
| | | | | | | | | | | | | | Years of | Term | Committee Memberships | | Name | Age | Tenure | Expiration | A | C | N&CG | I&T | Charles H. Cannon, Jr. Independent Former Executive Chairman and Chief Executive Officer, JBT Corporation | 71 | 19 | 2023 | | |  |  | David Dunbar President and Chief Executive Officer, Standex International Corporation | 62 | 9 | 2023 | | | | | Michael A. Hickey Independent Former Executive Vice President and President of Global Institutional, Ecolab, Inc. | 62 | 6 | 2023 | |  | | | Robin J. Davenport Independent Former Vice President of Corporate Finance, Parker Hannifin Corporation | 61 | 2 | 2024 | | | | | Jeffrey S. Edwards* Independent Chairman and Chief Executive Officer, Cooper Standard Holdings, Inc. | 61 | 9 | 2024 | | | | | B. Joanne Edwards* Independent Former Senior Vice President and General Manager, Eaton Corporation Plc. | 67 | 5 | 2024 | | | | | Thomas E. Chorman Independent Chief Executive Officer, Solar LED Innovations, LLC | 69 | 19 | 2025 | | | | | Thomas J. Hansen Lead Independent Director Former Executive Vice Chairman, Illinois Tool Works, Inc. | 74 | 10 | 2025 | | | | |
* Jeffrey S. Edwards and B. Joanne Edwards are not related. | | A Audit Committee N&CG Nominating & Corporate Governance Committee | C Compensation Committee | | N&CGI&T NominatingInnovation & Corporate
GovernanceTechnology Committee
| |  Chair Chair
| | | * New nominee for Director.
** Jeffrey S. Edwards and B. Joanne Edwards are not related.
|
| | | CORPORATE GOVERNANCE HIGHLIGHTSCorporate Governance Highlights | | |
We are committed to strong corporate governance practices, which promote the long-term interests of shareholders, strengthen financial integrity and hold our Board and management accountable. The highlights of our corporate governance practices include the following: | • | All non-employee directors are independent | | • | Regular executive sessions of independent directors | | • | All Board committees are comprised solely of independent directors | | • | Annual board and committee self-evaluations | | • | Risk oversight (including cybersecurity) by the full Board and committees | | • | Ongoing review of optimal Board composition | | • | Independent compensation consultant reports directly to the Compensation Committee | | • | Lead Independent Director | | • | Corporate Governance Guidelines | | • | Stock ownership guidelines for directors and executive officers |
Regular executive sessions of independent directors
Audit, Compensation and Nominating and Corporate Governance committees are comprised solely of independent directors
Annual board and committee self-evaluations
Risk oversight (including cybersecurity) by the full board and committees
Ongoing review of optimal Board composition
Independent compensation consultant reports directly to the Compensation Committee
Lead Independent Director
Corporate Governance Guidelines
Stock ownership guidelines for directors and executive officers
Policy against hedging and pledging of Company stock
Code of Conduct applies to directors & all employees
Annual advisory approval of executive compensation
Board and committees may engage outside advisors independently of management
Oversight of whistleblower hotline
Mandatory Board retirement age
| • | Policy against hedging and pledging of Company stock | | • | SEC compliant clawback policy has been adopted | | • | Code of Conduct applies to directors & all employees | | • | Annual advisory approval of executive compensation | | • | Board and committees may engage outside advisors independently of management | | • | Oversight of whistleblower hotline | | • | Mandatory Board retirement age | | • | Periodic committee chair and membership rotations | | • | Oversight of ESG strategy and reporting |
Item 2 2021 PROXY STATEMENTAdvisory
VoteonExecutiveCompensationWe are asking shareholders to vote on an advisory basis on the compensation paid to our Named Executive Officers as described in the Compensation Discussion and Analysis beginning on page 36 and the Compensation Tables beginning on page 54. Please see page 14for more information. Our Board recommends a vote FORthis Item. |
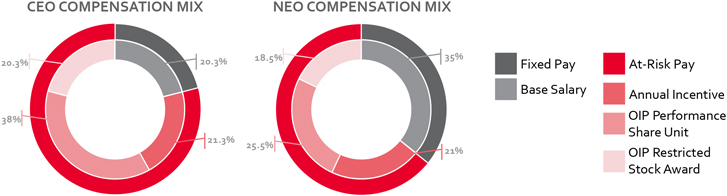
| At-Risk Compensation Mix | | | 7 | |
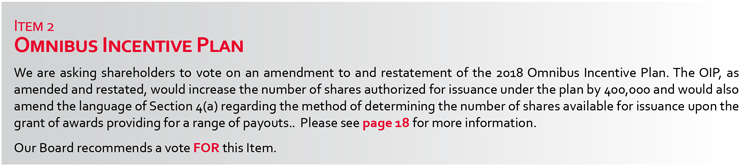
On October 23, 2018, our shareholders approved the 2018 Omnibus Incentive Plan. Under the OIP, as approved, there were 500,000 shares authorized for issuance. At the time of the approval, we believed this amount would be sufficient for award grants for the next 5 fiscal years. We have revised our estimates and we now believe there are sufficient shares available for anticipated FY 2022 grants, but there may not be sufficient shares available for FY 2023 grants. For this reason, the Board has approved and recommends an amendment to and restatement of the OIP to increase the number of shares authorized for issuance under the plan by 400,000. The Board also has approved and recommended an amendment to Section 4(a) of the OIP regarding the method of determining the number of shares available for issuance under the OIP. This amended and restated OIP would require that for every share granted under an award under the OIP, the number of total shares available for issuance be reduced by 1.0. Approval of this amendment and restatement will increase the number of currently available shares to over 600,000 and we believe this will be sufficient for anticipated grants through the next 5 fiscal years.
Please refer to page 18 for the full proposal and the plan summary. Please refer to Appendix A, starting on page 78 for the full text of the OIP, as amended and restated.
Below is some key information regarding grant practices, burn rate, dilution and overhang.
| | | | | | | | | | | | | | Equity Metric | | 2021 | | | 2020 | | | 2019 1 | | | | | | Percentage of equity awards granted to NEOs | | | 52 | % | | | 51 | % | | | 0 | % | | | | | Equity burn rate 2 | | | 1.29 | % | | | 0.98 | % | | | 0.11 | % | | | | | Dilution 3 | | | 3.87 | % | | | 5.09 | % | | | 5.82 | % | | | | | Overhang 4 | | | 2.81 | % | | | 2.11 | % | | | 1.88 | % |
| Named Executive Officer | | Actual Salary ($) | | | Stock Awards ($) | | | Non-Equity
Incentive Plan Compensation
($) | | | All Other Compensation ($) | | | Total
($) | | David Dunbar
President & CEO | | | 892,597 | | | | 3,405,266 | | | | 471,302 | | | | 164,853 | | | | 5,098,597 | | Ademir Sarcevic Vice President, CFO & Treasurer | | | 465,330 | | | | 799,455 | | | | 255,564 | | | | 46,848 | | | | 1,570,539 | | Alan Glass
Vice President, CLO & Secretary | | | 388,967 | | | | 536,910 | | | | 96,789 | | | | 52,462 | | | | 1,082,635 | | Annemarie Bell Chief Human Resources Officer | | | 311,512 | | | | 225,923 | | | | 177,054 | | | | 19,689 | | | | 734,304 | | Sean Valashinas
Chief Accounting Officer & Assistant Treasurer | | | 275,783 | | | | 154,791 | | | | 68,018 | | | | 18,140 | | | | 516,731 | | Paul Burns Former Vice President, Business Development & Strategy | | | 285,088 | | | | 392,302 | | | | - | | | | 24,155 | | | | 881,233 | | Flavio Maschera Former Chief Innovation & Technology Officer | | | 292,824 | | | | 245,835 | | | | - | | | | 1,312,086 | | | | 1,850,745 | |
| | 1 | FY 2019 grants made prior to the October 23, 2018 adoption of the OIP were made under the 2008 Long Term Incentive Plan. The values contained here include FY 2019 grants made under the OIP only.Note:
|
| 2 | The burn rate is calculated by taking the number of shares granted and dividing that by the weighted average basic Common Stock outstanding. The following table provides information regarding stock-settled, time-vested equity awards granted and performance-based, stock-settled equity awards granted over each of the last 3 fiscal years:
|
| | | | | | | | | | | | | | | | 2021 | | | 2020 | | | 2019 | | | | | | Time-Vested Restricted Shares/Units Granted | | | 72,475 | | | | 75,505 | | | | 16,273 | | | | | | MSPP Shares Granted | | | 19,311 | | | | 14,883 | | | | - | | | | | | Performance-Based Stock Units Granted (at target) | | | 69,071 | | | | 42,976 | | | | - | | | | | | Weighted Average Basic Common Stock Outstanding | | | 12,156,000 | | | | 12,324,000 | | | | 12,574,000 | |
| 3 | The dilution is calculated by taking the sum of (i) the number of shares granted and outstanding under awards at fiscal year end and (ii) the number of shares available for issuance under the OIP at fiscal year end, and dividing that sum by the number of outstanding Common Stock at fiscal year end.
|
| 4 | The overhang is calculated by taking the number of shares granted and outstanding under awards at fiscal year end and dividing it by the number of outstanding Common Stock at fiscal year end.
|
| | | | | | | | | | | | | | | | | | | | | | Named Executive Officer | | Actual Salary
($) | | | Stock Awards
($) | | | Non-Equity
Incentive Plan
Compensation
($) | | | All Other
Compensation
($) | | | Total ($) 1 | | | | | | | | David Dunbar President & CEO | | | 864,870 | | | | 3,681,435 | | | | 772,961 | | | | 110,204 | | | | 5,784,732 | | | | | | | | Ademir Sarcevic Vice President, CFO & Treasurer | | | 433,675 | | | | 894,037 | | | | 396,649 | | | | 26,638 | | | | 1,751,948 | | | | | | | | Alan J. Glass Vice President, CLO & Secretary | | | 365,907 | | | | 675,728 | | | | 171,298 | | | | 33,680 | | | | 1,254,084 | | | | | | | | Paul C. Burns Vice President of Business Development & Strategy | | | 365,907 | | | | 413,611 | | | | 316,709 | | | | 28,732 | | | | 1,124,959 | | | | | | | | James Hooven Vice President of Operations & Supply Chain | | | 334,950 | | | | 189,251 | | | | 253,561 | | | | 15,840 | | | | 793,602 | |
| Note: | This table provides thecertain summary compensation information for FY 2021.2023. The Summary Compensation Table and associated footnotes may be found starting on page 6454. |
| 1 | As reported in The items here are from select columns of the Summary Compensation Table and not all items are shown here. The total is as reported in the Summary Compensation Table.
|
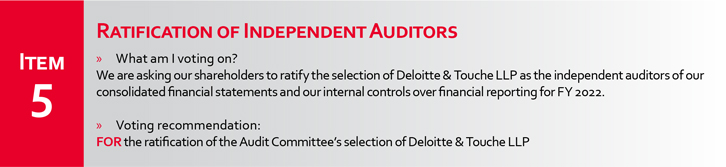
Item 3 RatificationofAppointmentofDeloitte&ToucheLLPasIndependent Auditors We are asking shareholders to ratify the selection of Deloitte & Touche LLP as the independent auditors of our consolidated financial statements and our internal controls over financial reporting for FY 2024. Please see page 15for more information. Our Board recommends a vote FORthis Item. |
| Audit | | 2021 PROXY STATEMENT | | | 9 | |
As required by the Dodd-Frank Wall Street Reform and Consumer Protection Act, every six years, the Board provides shareholders with the opportunity to cast an advisory vote on the frequency of the advisory vote to approve our executive compensation. This year, we are seeking a non-binding determination from our shareholders as to how often the “Say on Pay” advisory vote should be held. Shareholders have the following frequency options to choose from: each year, every two years or every three years.
When this advisory vote was last held in 2015, shareholders indicated a preference to hold the advisory vote on executive compensation each year, and the Board continued this practice.
The Board continues to believe that an annual advisory Say on Pay vote is the most appropriate policy for our shareholders and the Company at this time. An annual advisory vote allows the Board to receive timely, ongoing feedback from our shareholders. This assists the Board in taking shareholder views into account when considering changes to the executive compensation program. Additionally, an annual advisory vote is currently the standard desired by many shareholders.
Although this vote is non-binding, the Board values the opinions of the Company’s shareholders and will consider the outcome of the vote when making future decisions on the frequency of our Say on Pay proposals.
The Audit Committee has approved Deloitte & Touche LLP (“Deloitte”) to serve as our independent registered public accounting firmauditors for the 20222024 fiscal year. Deloitte has served as the Company’s independent auditors since 2021. Prior to 2021, Grant Thornton, LLP (“Grant Thornton”) served as the Company’s independent auditor.August 26, 2020. During this time, there have been no disagreements between the Company and either Deloitte or Grant Thornton on any matter of accounting principles or practices, financial statement disclosures or auditing scope or procedure. Also, during this time, neither Deloitte’s report nor Grant Thornton’s reportreports on the Company’s financial statements containeddid not contain any adverse opinion or a disclaimer of opinion, nor was itwere they qualified or modified as to uncertainty, audit scope or accounting principles. The following are the aggregate audit and non-audit fees billed to Standex by Deloitte, the member firms of Deloitte Touche Tohmatsu, and their respective affiliates for FY 20212022 and the aggregate audit and non-audit fees billed in FY 2020 to Standex by Grant Thornton, who served as Standex’s independent auditors during that year.2023. A full explanation of the types of fees and Deloitte’s role is contained in “Ratification of Independent Auditors” starting on page 2715. | | Type of Fees | | 2020 ($)* | | | 2021 ($)* | | | FY 2022 ($)* | | FY 2023 ($)* | | | Audit Fees | | | 1,563,000 | | | | 1,371,000 | | | 1,422,000 | | | 1,542,000 | | | Audit-Related Fees | | | 239,000 | | | | - | | | - | | | 15,000 | | | Tax Fees | | | 21,000 | | | | 94,000 | | | 34,000 | | | 28,000 | | | All Other Fees | | | 1,000 | | | | - | | | 113,000 | | | 2,000 | | | Total Fees | | | 1,824,000 | | | | 1,465,000 | | | | 1,569,000 | | | | 1,587,000 | |
| | * | Amounts have been rounded to the nearest thousand. |
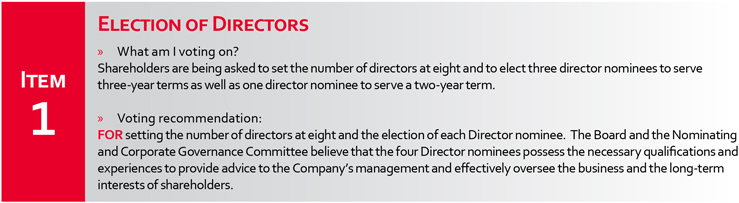
Please see “Questions & Answers” starting on page 69 for important information about these proxy materials, voting, the 2023 Annual Meeting, Company documents, communication with the Board and the deadlines to submit shareholder proposals and Director nominees for the 2024 annual meeting of shareholders. Item 1 | Election of Directors » What am I voting on? Shareholders are being asked to elect three director nominees to serve a three-year term. » Voting recommendation: FORthe election of each Director nominee. The Board and the Nominating and Corporate Governance Committee believe that the three Director nominees possess the necessary qualifications and experiences to provide advice to the nearest thousand.Company’s management and effectively oversee the business and the long-term interests of shareholders. |
Our Board currently consists of seven directors; the election of Robin J. Davenport at the Annual Meeting would bring the board membership to eight. Prior to the 2020 annual meeting, the board had eight directors. At the 2020 annual meeting, Dr. Dan Hogan retired after 35 years of service. The Board had intended to recruit and nominate a successor to Dr. Hogan for election at the 2020 annual meeting. However, because of the challenges raised by the COVID-19 pandemic, the Board and Nominating & Corporate Governance Committee were unable to conduct a robust interview process in order to nominate a successor for election at the 2020 annual meeting. Over the past year, the Nominating & Corporate Governance Committee was able to engage in the recruitment process, and in April 2021, appointed Robin J. Davenport as a special advisor to the Board. She, along with the Class I directors, whose current terms are expiring, are being nominated for election to the Board. We have three classes of directors, with each class being as equal in size as possible. The term of each class is three years and class terms expire on a rolling basis, so that one class of directors is elected each year. The current Class I directors arethree director nominees, Charles H. Cannon, Jr., Jeffrey S. EdwardsDavid Dunbar and B. Joanne Edwards. WithMichael A. Hickey, are current Class II members of the addition of Ms. Davenport,Board. Their term is set to expire at the number of Class I2023 Annual Meeting. The Board believes that Mr. Cannon, Mr. Dunbar and Mr. Hickey possess the skills, abilities and experience to continue serving as directors would be four, leaving only twoand has nominated them to serve on the Board for an additional three-year term, to expire at the 2026 annual meeting. The Board recommends that shareholders elect Mr. Cannon, Mr. Dunbar and Mr. Hickey as Class II directors and two Class III directors (terms expiring at the 2023 and 2022 annual meetings, respectively). To keep the class size as equal as possible, as required by the NYSE listing standards, the Board has nominated Ms. Davenport, Mr. Edwards, and Ms. Edwards as Class I directors, with terms expiring at the 2024 annual meeting, and Mr. Cannon asfor a Class II director, with athree-year term expiring at the 2023 annual meeting. This will enable each Class to be balanced and allow for orderly election cycles. For the foregoing, the Board recommends that shareholders set the number of directors at eight, elect Ms. Davenport, Mr. Edwards, and Ms. Edwards as Class I directors for three-year terms, expiring at the 2024 annual meeting, and elect Mr. Cannon as a Class II director for a two-year term, expiring at the 20232026 annual meeting.
BOARDOF DIRECTORS MEMBERSHIP CRITERIA
| Board of Directors Membership Criteria |
The Board and the Nominating and Corporate Governance Committee believe that there are general qualifications that all directors must exhibit and other key qualifications and experiences that should be represented on the Board as a whole, but not necessarily by each individual director. QUALIFICATIONS REQUIREDOF ALL DIRECTORSQualifications Required of All Directors
The Board and the Nominating and Corporate Governance Committee require that each director be a recognized person of high integrity with a proven record of success in his or her field, and be able to devote the time and effort necessary to fulfill his or her responsibilities to the Company. Each director must demonstrate innovative thinking, familiarity with and respect for corporate governance requirements and practices, an appreciation of multiple global cultures and a commitment to sustainability and to dealing responsibly with social issues. In addition, potential director candidates are interviewed to assess intangible qualities, including the individual’s ability to engage in constructive deliberations, by asking difficult questions, working collaboratively, and respecting differing views of other Board members. Our Consideration of Diversity Diversity of Board membership is important, because a variety of points of view improves the quality of dialogue, contributes to a more effective decision-making process and enhances overall culture in the boardroom. In evaluating candidates for Board membership, the Board and the Nominating and Corporate Governance Committee consider many factors based on the specific needs of the business and what is in the best interests of the Company’s shareholders. This includes diversity of professional experience, race, ethnicity, gender, age and cultural background. In addition, the Board and the Nominating and Corporate Governance Committee focus on how the experiences and skill sets of each director complement those of fellow directors to create a balanced Board with diverse viewpoints and deep expertise. |
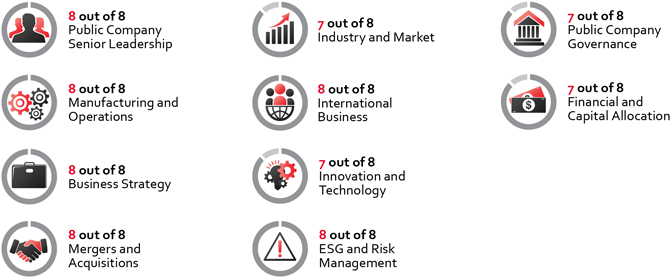
BOARD COMPOSITIONBoard Composition & REFRESHMENTRefreshment
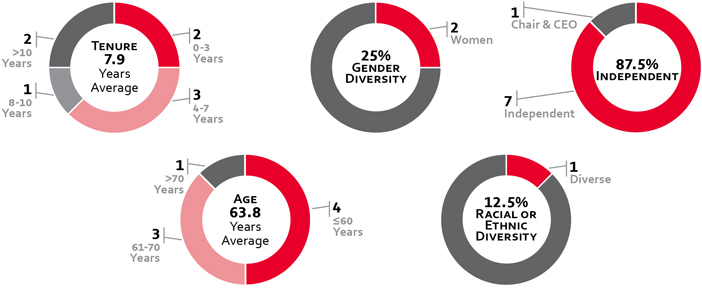
The Board regularly reviews the skills, experience and background that it believes are desirable to be represented on the Board. On an annual basis, the Board reviews each director’s skills and assesses whether there are gaps that need to be filled. As a result, recruitment is an ongoing activity. A snapshot of our directors’ skills, including director nominees, is below, while the full skills matrix can be found under “Board Self-Assessment & Skills Matrix” of this Proxy Statement on page 3422. The Board aims to strike a balance between the experience that comes from long-term service on the Board with the new perspective that new Board members bring, while being sensitive to the benefits of gender and racial diversity. The Board also has a mandatory retirement policy, under which no director may stand for re-election if he or she has reached the age of 75. The election of Ms. Davenport would bring the refreshment to 6 directors, two of which are female and one of which is a racial minority, over the past 8 years. We believe this balanced approach creates a renewed perspective that is beneficial to shareholders. Please refer to “Identifying and Evaluating Candidates for Board Membership” on page 3523for further information. | | | | Snapshot of 2023 Director Nominees and Continuing Directors | 12 | | 2021 PROXY STATEMENT
| | |
Demographics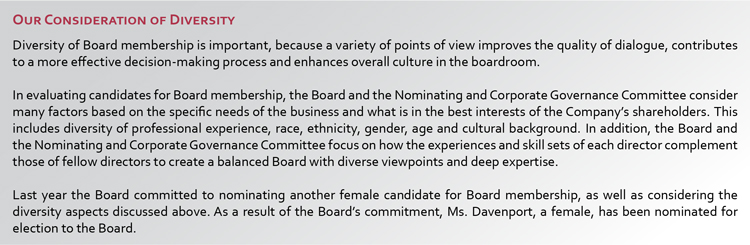
SNAPSHOTOF 2021 DIRECTOR NOMINEESAND CONTINUING DIRECTORS
DEMOGRAPHICS
SKILLS
| 2023 Director Nominees | | 2021 PROXY STATEMENT | | | 13 | |
2021 DIRECTOR NOMINEES
The following is biographical information for each director nominee and each continuing director. The information includes names, ages, principal occupations for at least the past five years, the year in which each director joined our Board and certain other information. The information is current as of September 10, 2021,8, 2023, except for each director’s age, which is current as ofOctober 26, 2021. CLASS I DIRECTORS - TERM EXPIRING 2024:24, 2023.
| | | | Required Vote & Recommendation | 14 | | 2021 PROXY STATEMENT
| | |
CLASS II DIRECTOR - TERM EXPIRING 2023:
REQUIRED VOTE & RECOMMENDATION
Our By-Laws require that, in an uncontested election, each director be elected by a majority of the votes cast. A majority of votes cast means that the number of votes cast “FOR” a director’s election exceeds the number of votes cast “AGAINST” that director. Shareholders that either mark “ABSTAIN” on the proxy card or otherwise abstain from voting will not be counted as either “FOR” or “AGAINST.” Broker non-votes will not be counted as either “FOR” or “AGAINST.” In the event that there is a contested election, each director will be elected by a plurality of the votes cast, which means the directors receiving the largest number of “FOR” votes will be elected to the open positions.
In the event that any nominee becomes unavailable, the Board may either choose a substitute or postpone filling the vacancy until a qualified candidate is identified. If there is a substitute, the individuals acting under your proxy may vote for the election of a substitute. The nominees have indicated their willingness to serve as directors and we have no reason to believe that any nominee will become unavailable.
The Board of Directors recommends that you vote “FOR” setting the number of directors at eight and “FOR” the election of each nominee.
CONTINUING DIRECTORS
CLASS III DIRECTORS - TERM EXPIRING 2022:
CLASS II DIRECTORS - TERM EXPIRING 2023:
The Compensation Committee recommended, and our Board has approved, subject to shareholder approval, an amendment to and restatement of the 2018 Omnibus Incentive Plan (“OIP”). This amended and restated OIP would increase the number of shares authorized for grants under the OIP by 400,000 to 900,000 shares of our Common Stock. This is the first time we have requested approval to increase the number of shares authorized for issuance under the OIP.
We are also seeking shareholder approval to amend Section 4(a) of the OIP regarding the method of determining the number of shares available for issuance under the OIP. This amended and restated OIP would require that for every share granted under an award under the OIP, the number of total shares available for issuance be reduced by 1.0. Currently, for awards that provide for a range of potential payouts, the OIP requires shares available for issuance be reduced by the maximum number of shares which may be paid under such awards. By amending Section 4(a), we believe this method of determining shares available for issuance is a more accurate reflection of our historic awards and payouts, which have generally been at or below target levels.
Our Board recommends that shareholders approve the amended and restated OIP because it will allow the Company to successfully attract and retain the best possible candidates. We previously believed that the initial 500,000 authorized shares would be sufficient to cover our anticipated needs for a period of 5 years. However, we now believe that the initial authorized shares will be sufficient for anticipated grants during FY 2022, but will likely not be sufficient for grants in FY 2023. For these reasons, the Board recommends that shareholders approve an amended and restated OIP to increase the number of Common Stock authorized for future awards to be granted under the OIP and to amend Section 4(a).
As of June 30, 2021, the number of shares of Common Stock that remained available for future grants was 46,791 using the current method of determining shares available for issuance, or 208,971 using the proposed method of determining shares available for issuance. If this proposal is approved, the combined 608,971 shares available under the OIP would represent approximately 5% of fully diluted Common Stock outstanding as of June 30, 2021. The Board believes that this number of shares represents a reasonable amount of potential equity dilution in light of the purposes of the OIP, as described below. If the amended and restated OIP is approved and we issue awards in amounts consistent with the three-year average burn rate described below, it is anticipated that the available shares will meet our needs for approximately 5 years. Assuming shareholders approve this proposal, we will file a Registration Statement on Form S-8 to register the additional Common Stock available for issuance.
SIGNIFICANT HISTORICAL AWARD INFORMATION
The following table provides information regarding the grant of equity awards over the past three fiscal years. The information accounts for PSU awards at target rather than maximum.
| | | | | | | | | | | | | | Equity Metric | | 2021 | | | 2020 | | | 2019 1 | | | | | | Percentage of equity awards granted to NEOs | | | 52% | | | | 51% | | | | 0% | | | | | | Equity burn rate 2 | | | 1.29% | | | | 0.98% | | | | 0.11% | | | | | | Dilution 3 | | | 3.87% | | | | 5.09% | | | | 5.82% | | | | | | Overhang 4 | | | 2.81% | | | | 2.11% | | | | 1.88% | |
| 1 | FY 2019 grants made prior to the October 23, 2018 adoption of the OIP were made under the 2008 Long Term Incentive Plan. The values contained here include FY 2019 grants made under the OIP only.
|
| 2 | The burn rate is calculated by taking the number of shares granted and dividing that by the weighted average basic Common Stock outstanding. The following table provides information regarding stock-settled, time-vested equity awards granted and performance-based, stock-settled equity awards granted over each of the last 3 fiscal years:
|
| | | | | | | | | | | | | | | | 2021 | | | 2020 | | | 2019 | | | | | | Time-Vested Restricted Shares/Units Granted | | | 72,475 | | | | 75,505 | | | | 16,273 | | | | | | MSPP Shares Granted | | | 19,311 | | | | 14,883 | | | | - | | | | | | Performance-Based Stock Units Granted (at target) | | | 69,071 | | | | 42,976 | | | | - | | | | | | Weighted Average Basic Common Stock Outstanding | | | 12,156,000 | | | | 12,324,000 | | | | 12,574,000 | |
| 3 | The dilution is calculated by taking the sum of (i)votes cast “FOR” a director’s election exceeds the number of shares granted and outstanding under awards at fiscal year end and (ii)votes cast “AGAINST” that director. Shareholders that either mark “ABSTAIN” on the proxy card or otherwise abstain from voting will not be counted as either “FOR” or “AGAINST.” Broker non-votes will not be counted as either “FOR” or “AGAINST.”
In the event that there is a contested election, each director will be elected by a plurality of the votes cast, which means the directors receiving the largest number of shares available“FOR” votes will be elected to the open positions. | In the event that any nominee becomes unavailable, the Board may either choose a substitute or postpone filling the vacancy until a qualified candidate is identified. If there is a substitute, the individuals acting under your proxy may vote for issuance under the OIP at fiscal year end,election of a substitute. The nominees have indicated their willingness to serve as directors and dividingwe have no reason to believe that sum byeither nominee will become unavailable. The Board of Directors recommends that you vote “FOR” the numberelection of outstanding Common Stock at fiscal year end.each nominee. |
Class I Directors - Term Expiring 2024: Class III Directors - Term Expiring 2025: 
| | 42023 Proxy Statement13 | The overhang is calculated by taking the number of shares granted and outstanding under awards at fiscal year end and dividing it by the number of outstanding Common Stock at fiscal year end.
|
OIP PLAN SUMMARY
The following is a brief description of the principal features of the OIP. This summary is qualified by reference to the full text of the OIP, which is included, as amended and restated, as Appendix A to this Proxy Statement, starting on page 78.
PURPOSE
The purpose of the OIP is to encourage and enable executives, employees, directors and others (as defined in the OIP) to acquire a proprietary interest in Standex. This enables Standex to:
| u | Item 2 | attract and maintain executive, managerial and other key employees;Advisory Vote on Executive Compensation
|
| u | | motivate participants
» What am I voting on?
We are asking shareholders to achieve long-range goals consistent with increases in shareholder value;
|
| u | | provide incentive compensation opportunities that are flexible and competitive with those offered by other businesses;
|
| u | | support the Company’s executive compensation program, as discussed in the Compensation Discussion & Analysis section of this Proxy Statement; and
|
| u | | align the interests of participants with shareholder interests through compensation that is basedvote on an advisory basis on the value of the Company’s common stock.
|
ELIGIBILITY
The OIP authorizes the following types of awards to be made to any employee, officer, non-employee director, or Third Party Service Provider, as defined in the OIP, of the Company and its subsidiaries, as designated by the Compensation Committee. All awards will be evidenced by a written award agreement between the Company and the participant and will include such provisions and conditions as may be specified by the Compensation Committee.
TYPESOF AWARDS
STOCK OPTIONS
Stock options give the holder the right to purchase shares of common stock at a specified price during specified time periods. The exercise price of an option granted under the OIP may not be less than the fair market value of the common stock on the date of grant. Stock options granted under the OIP have a maximum term of 10 years. The OIP authorizes both incentive stock options and nonqualified stock options. Incentive stock options can only be granted to employees of the Company or its subsidiaries and have an annual fair market value limit of $100,000 per recipient. Stock options are not a part of the Company��s current compensation program.
RESTRICTED STOCKAND RESTRICTED STOCK UNITS
Awards of Restricted Stock (“RSAs”) grant the recipient shares of common stock which are subject to certain vesting requirements. Restricted Stock Unit (“RSU”) awards grant the recipient the right to receive a certain number of common stock at vesting, subject to certain vesting requirements. Recipients of such awards do not have any voting rights until the vesting requirements are satisfied, unless the Compensation Committee determines otherwise. Vesting requirements include continued employment, achievement of pre-established goals or a combination of both. The Company currently grants time-based RSAs, which do have voting rights, and also grants RSUs as part of the Management Stock Purchase Plan, which do not have voting rights.
STOCK APPRECIATION RIGHTS
Stock Appreciation Rights (“SARs”) give the holder the right to receive, either in cash or common stock equivalent, the excess of the fair market value of one share of common stock on the date of exercise, over the exercise price of the SAR. The exercise price of the SAR may not be less than the fair market value of the common stock on the date of grant. SARs granted under the OIP have a maximum term of 10 years. SARs are not a part of the Company’s current compensation program.
UNRESTRICTED STOCK AWARDS
The Compensation Committee, in its discretion, may grant or sell to any eligible person shares of common stock free of restrictions. The sales price of such stock awards is determined by the Compensation Committee. The OIP allows the granting or selling of unrestricted stock awards as payment for past services or other valid consideration. Unrestricted stock awards cannot be sold, assigned, transferred, pledged or otherwise encumbered.
PERFORMANCE AWARDS
Performance awards grant the recipient the right to receive, either in cash or shares of common stock, a payout upon the attainment of pre-established performance goals. The Company’s current compensation program includes performance share unit awards, as a component of long-term equity incentive compensation, and performance cash awards, as annual short-term incentive compensation.
SHARES
MAXIMUM NUMBEROF SHARES AVAILABLE
With the amendment, the maximum number of shares of Company common stock which may be allocated to awards, including SARs, is 900,000 shares.
SHARE POOLAND SHARE COUNTING
With the amendment, each share issued pursuant to an award under the OIP will reduce the number of shares available by one share. Shares subject to awards under the OIP that terminate or expire unexercised, or are canceled, terminated, forfeited or lapse for any reason, or are exchanged for an award that does not involve the issuance of shares and shares underlying awards that are ultimately settled in cash, will become available for future grants of awards under the OIP. Similarly, in the event that a maximum payout is not reached, the unearned shares originally subject to the award will be added back to the share reserve. The following shares do not return to the share pool and are not available for issuance under the OIP: (i) shares used to pay the exercise price or withholding taxes related to an outstanding stock option or SAR; (ii) shares that are not issued or delivered upon the exercise of an SAR; and (iii) shares repurchased by the Company on the open market with proceeds from the exercise of a stock option.
EXPECTED DURATIONOFTHE SHARE RESERVE
If this proposal is approved by our shareholders, we expect that the share reserve under the OIP will be sufficient for awards for approximately 5 years. Expectations regarding future share usage could be impacted by a number of factors such as award type mix; hiring and promotion activity at the executive level; the rate at which shares are returned to the OIP’s share pool upon expiration, forfeiture or cash settlement; the future performance of our stock price; the consequences of acquiring other companies; and other factors. While we believe that the assumptions are reasonable, future share usage may differ from current expectations.
ADJUSTMENTSTO SHARE RESERVE
The number of shares allocated to the OIP shall be appropriately adjusted to reflect any subsequent equity restructuring, such as stock dividends, stock splits, reverse stock splits and similar matters affecting the overall number of the Company’s outstanding shares. Similarly, in the event of any other change in corporate capitalization, the Compensation Committee has the authority to make equitable adjustments to prevent dilution or enlargement of any rights granted under the OIP.
ADMINISTRATION
The OIP is administered by the Compensation Committee. The Compensation Committee has the authority to:
| u | | determine the type or types of awardscompensation paid to be granted to each participant and the amount, terms and conditions thereof;
|
| u | | establish, adopt or revise any rules, regulations, guidelines and procedures as it may deem advisable to carry out the provisions and purposes and administer the OIP; and
|
| u | | prescribe forms of award agreements, and make rules, interpretations and any and all other decisions and determinations that may be required under the OIP.
|
Additionally, the Compensation Committee may, by resolution, authorize any officer of the Company to designate employees as award recipients and determine the amount of such awards. This delegation is limited by: (i) not allowing the authorized officer to grant an award to an officer (defined as a reporting person under Section 16 of the Exchange Act); (ii) requiring the resolution to include the total number and/or dollar value of awards the officer is allowed to grant; and (iii) requiring the officer to periodically report to the Compensation Committee regarding the nature and scope of awards granted by the officer. Lastly, the Compensation Committee may expressly delegate to one or more of its members or to one or more officers of the Company or its affiliates or to one or more agents or advisors its administrative duties or powers under the OIP.
TREATMENTOF AWARDSUPON CERTAIN EVENTS
TERMINATIONOF CONTINUOUS SERVICE
The applicable award agreement or special plan document governing an award will specify the treatment of such award upon the termination of a participant’s continuous service. Continuous service means the absence of any interruption or termination of service as an employee, officer or director; provided that the following will not be considered an interruption in service: (i) a participant transfers employment, without interruption, between the Company and an affiliate or between affiliates, (ii) in the case of a spin-off, sale or disposition transaction where the Compensation Committee determines that no interruption will result or (iii) the participant is granted an unpaid leave of absence authorized in writing by the Company that does not exceed 12 months. The OIP defines an affiliate as any parent company of Company and each subsidiary of the Company, as those terms are defined in Section 424 of the IRC.
CHANGEIN CONTROL
Unless otherwise provided in an award agreement or any special plan document or separate agreement with a participant governing an award, upon the occurrence of a change in control (“CIC”) of the Company in which awards are not assumed by the surviving entity or otherwise converted into a Replacement Award, as defined in the OIP, the following shall occur:
| u | | A participant’s then-outstanding stock options and SARs that are not vested and are only subject to continuous service shall immediately become fully vested and exercisable over the exercise period set forth in the applicable award agreement. The Compensation Committee may elect to cancel such awards and pay a cash amount, unless the exercise price exceeds the value of the consideration received by the participant as a result of the CIC.
|
| u | | All other awards subject to continuous service shall become fully vested.
|
| u | | A participant’s then-outstanding stock options and SARs that are not vested and are subject to attaining certain performance measures shall immediately become vested and exercisable as of the date of the CIC. Where performance measures provide for a range of payouts, the number of shares that shall vest is based on the higher of (i) actual performance through the date of the CIC, or (ii) target performance. No payment shall be made if the exercise price exceeds the value of the consideration received by the participant as a result of the CIC.
|
| u | | All other awards subject to attaining certain performance measures shall immediately vest and be settled based on the higher of (i) actual performance through the date of the CIC, or (ii) target performance.
|
Unless otherwise provided in an award agreement or any special plan document or separate agreement with a participant governing an award, if there is a change in control of the Company and a qualifying Replacement Award is provided to the participant, the participant shall not receive any automatic vesting or acceleration of the Replaced Award, as defined in the OIP. However, if a participant’s employment is involuntarily terminated other than for cause after such a change in control, then a participant’s Replacement Award in the form of:
| u | | stock options or SARs shall become fully exercisable;
|
| u | | performance-based awards shall be deemed to be fully satisfied at the target level and be paid within 60 days of the termination; and
|
| u | | service-based awards shall become fully vested and paid within 60 days of the termination.
|
FORFEITURE EVENTS
Awards under the OIP will be subject to any compensation recoupment policy that the Company may adopt from time to time that is applicable to the participant, including the claw back policy. An award agreement may specify that an award will be reduced, canceled, forfeited or recouped upon certain events, including (i) termination of employment for cause; (ii) violation of material Company policies; (iii) breach of noncompetition, confidentiality or other restrictive covenants that may apply to the participant; (iv) other conduct by the participant that is detrimental to the business or reputation of the Company; and (v) a later determination that the vesting of, or amount realized from, a performance award was based on materially inaccurate financial statements or performance metric criteria, whether or not the participant caused or contributed to such inaccuracy. The Company will also seek to recover any granted awards as required by the provisions of the Dodd-Frank Wall Street Reform and Consumer Protection Act or any other law or listing standards of the NYSE.
TERMINATION & AMENDMENT
The OIP became effective on October 23, 2018 and shall continue until October 23, 2028 unless earlier terminated by the Board or the Compensation Committee. The Board or the Compensation Committee may, at any time and from time to time, amend, modify or terminate the OIP, unless such an amendment or modification would require shareholder approval under applicable laws, regulations or the NYSE rules.
The Compensation Committee may amend, modify or terminate an outstanding award without the approval of the participant, provided however, (i) the value of such award may not be reduced or diminished without the participant’s consent; (ii) the original term of an option or SAR may not be extended without prior approval of the Company’s shareholders; (iii) subject to the anti-dilution provisions of the OIP, the exercise price of an option or base price of an SAR may not be reduced, directly or indirectly (such as an exchange of an “underwater” option or SAR for cash or for another award), without the prior approval of the Company’s shareholders; and (iv) no termination, amendment or modification of the OIP will adversely affect any award previously made under the OIP without the consent of the affected participant.
TAX CONSEQUENCESOF AWARDS
The following discussion is limited to a summary of the U.S. federal income tax provisions relating to the making, exercising and vesting of awards under the OIP and the subsequent sale of common stock acquired under the OIP. The tax consequences of awards may vary depending upon the particular circumstances, and it should be noted that the income tax laws, regulations and interpretations thereof change frequently. Participants should rely upon their own tax advisors for advice concerning the specific tax consequences applicable to them, including the applicability and effect of state, local and foreign tax laws.
NONSTATUTORY STOCK OPTIONS
There will be no federal income tax consequences to the optionee or to the Company upon the grant of a stock option under the OIP. When the optionee exercises a stock option, however, they will recognize ordinary income in an amount equal to the excess of the fair market value of the common stock received upon exercise over the exercise price, and the Company expects that it will be allowed a corresponding deduction. Any gain that the optionee realizes when the optionee later sells or disposes of the option shares will be short-term or long-term capital gain, depending on how long the shares were held.
STOCK APPRECIATION RIGHTS
At the time the award is granted, a participant receiving a SAR will not recognize income, and the Company will not be allowed a tax deduction. When the participant exercises the SAR, the amount of cash and the fair market value of any shares of common stock received will be ordinary income to the participant and the Company expects that it will be allowed a corresponding income tax deduction at that time.
RESTRICTED STOCK
Generally, the participant will not recognize income and the Company will not be allowed a tax deduction, at the time a restricted stock award is granted, provided that the award is subject to restrictions on transfer and is subject to a substantial risk of forfeiture. When the restrictions lapse, the participant will recognize ordinary income equal to the fair market value of the common stock as of that date (less any amount paid for the stock), and the Company will be allowed a corresponding income tax deduction at that time, subject to any applicable limitations under IRC Section 162(m). If the participant files an election under IRC Section 83(b) within 30 days after the date of grant of the restricted stock, they will recognize ordinary income as of the date of grant equal to the fair market value of the stock on that date (less any amount paid for the stock), and the Company will be allowed a corresponding income tax deduction at that time, subject to applicable IRC Section 162(m) limitations. Any future appreciation in the stock will be taxable to the participant at capital gains rates. However, if the stock is later forfeited, the participant will not be able to recover the tax previously paid pursuant to the election. To the extent unrestricted dividends are paid during the restricted period under the applicable award agreement, any such dividends will be taxable to the participant as ordinary income and will be deductible by the Company unless the participant has made an election under IRC Section 83(b), in which case the dividends will thereafter be taxable to the participant as dividends and will not be deductible by the Company.
STOCK UNITS
A participant will not recognize income, and the Company will not be allowed a tax deduction, at the time a stock unit award is granted. Stock unit awards are typically RSUs or PSUs. Upon receipt of shares of common stock (or the equivalent value in cash) in settlement of a stock unit award, a participant will recognize ordinary income equal to the fair market value of the common stock or other property as of that date, and the Company will be allowed a corresponding income tax deduction at that time, subject to any applicable limitations under IRC Section 162(m).
CASH-BASED AWARDS
A participant will not recognize income at the time a cash-based award is granted (for example, when the performance goals are established). Upon receipt of cash in settlement of the award, a participant will recognize ordinary income equal to the cash received. The Company will be allowed a corresponding income tax deduction at the time the award is accrued under GAAP, as long as the award is settled within 2 1/2 months of the end of the fiscal year and subject to any applicable limitations under IRC Section 162(m). Otherwise, the Company will be allowed a corresponding income tax deduction at the time the award is paid.
IRC SECTION 409A
If an award is subject to IRC Section 409A (which relates to nonqualified deferred compensation plans), and if the requirements of Section 409A are not met, the taxable events as described above could apply earlier than described, and could result in the imposition of additional taxes and penalties. All awards that comply with the terms of the OIP, however, are intended to be exempt from the application of Section 409A or meet the requirements of Section 409A in order to avoid such early taxation and penalties.
TAX WITHHOLDING
The Company has the right to deduct or withhold, or require a participant to remit to the Company, an amount sufficient to satisfy the Company’s federal, state and local tax withholding obligations (including employment taxes) imposed by law with respect to any exercise, lapse of restriction or other taxable event arising as a result of an award under the OIP. The Compensation Committee may, at the time the award is granted or thereafter, require or permit that any such withholding requirement be satisfied, in whole or in part, by delivery of, or withholding from the award, shares having a fair market value on the date of withholding equal to the amount required to be withheld for tax purposes.
BENEFITSTO NAMED EXECUTIVE OFFICERS & OTHERS
Because awards under the OIP are discretionary, benefits or amounts that may be received by or allocated to eligible participants are not presently determinable. No awards that are contingent upon obtaining shareholder approval of the amendment of the OIP have been made.
The following table shows all of the awards under the OIP for FY 2021:
| | | | | Name and Position | | Number of Shares of Common
Stock Covered by Awards 1 | | | | David Dunbar, Chair, President & CEO
| | | 50,260 | | | | Ademir Sarcevic, Vice President, CFO & Treasurer
| | | 13,487 | | | | Alan J. Glass, Vice President, CLO & Secretary
| | | 8,755 | | | | Paul C. Burns, Vice President of Business Development & Strategy
| | | 7,460 | | | | James Hooven, Vice President of Operations & Supply Chain
| | | 3,218 | | | | All currentour named executive officers as a group
| | | 91,844 | | | | All current non-employee directors as a group
| | | 14,781 | | | | All employees as a group (excluding current executive officers)
| | | 54,232 | |
| 1 | The awards includeddescribed in this column are RSAs and PSUs (at target) made underProxy Statement.
» Voting recommendation:
FOR the OIP during FY 2021, and RSUs awarded pursuant to an MSPP deferral during FY 2021.say-on-pay proposal
|
REQUIRED VOTE & RECOMMENDATION
Approval of this proposal will require the affirmative vote of a majority of the votes cast in person or represented by proxy. Abstentions will not count as votes cast on this proposal, so abstentions will have no effect on the outcome. Broker non-votes will not be considered to have voted on this proposal, so will have no effect on the outcome.
The Board recommends that you vote “FOR” the amendment to and restatement of the 2018 Standex Omnibus Incentive Plan.
At each annual meeting, the Board provides shareholders with the opportunity to cast an advisory vote to approve the compensation of our named executive officers. Please see the “Summary Compensation Table” starting on page 6454for full details. This proposal, commonly known as a “Say on Pay” proposal, gives our shareholders the opportunity to endorse or not endorse our executive compensation programs and policies and the total compensation paid to our named executive officers. This advisory vote does not address any specific element of compensation, but rather the overall compensation of our named executive officers and our compensation philosophy, policies and practices, as detailed in the “Compensation Discussion & Analysis” starting on page 4736. Although this vote is non-binding, the Board values the opinions of the Company’s shareholders and will consider the outcome of the vote when making future compensation decisions for our named executive officers. As described in more detail in the Compensation Discussion and Analysis (“CD&A”) section, we have designed our executive compensation programs to align the long-term interests of our executives with those of our shareholders, attract and retain talented individuals and reward current performance. A large portion of the compensation is tied to the Company’s performance and is paid in both performance and time-based equity. This closely aligns both the short-term and long-term interests of our executives with those of shareholders and drives the creation of shareholder value. We encourage shareholders to review the CD&A, which describes our philosophy and business strategy underpinning the programs, the individual elements of the compensation programs and how our compensation plans are administered. REQUIRED VOTE & RECOMMENDATION
| Required Vote & Recommendation |
Approval of this advisory proposal will require the affirmative vote of a majority of the votes cast in person or represented by proxy. Abstentions will not count as votes cast on this proposal, so abstentions will have no effect on the outcome. Broker non-votesnon- votes will not be considered to have voted on this proposal, so will have no effect on the outcome. The advisory vote on executive compensation is non-binding, therefore, our Board will not be obligated to take any compensation actions or adjust our executive compensation programs or policies as a result of the vote. Notwithstanding, the resolution will be considered passed with the affirmative vote of the majority of the votes cast at the Annual Meeting. The Board recommends that you vote “FOR” the following non-binding resolution: RESOLVED, that the compensation of the Company’s named executive officers, as disclosed pursuant to Item 402 of Regulation S-K, including the Compensation Discussion and Analysis, compensation tables and narrative discussion, is hereby APPROVED. Item 3 | | | | | 2021 PROXY STATEMENTRatification of Independent Auditors
| | | 25 | |
Every six years, as required by the Dodd-Frank Wall Street Reform and Consumer Protection Act, the Board provides shareholders with the opportunity to cast an advisory vote on the frequency of the advisory vote to approve our executive compensation. This year, we are seeking a non-binding determination from our shareholders as to how often the “Say on Pay” advisory vote should be held. Shareholders have the following frequency options to choose from: each year, every two years or every three years.
When this advisory vote was last held in 2015, shareholders indicated a preference to hold the advisory vote on executive compensation each year and the Board continued this practice.
The Board continues to believe that an annual advisory Say on Pay vote is the most appropriate policy for our shareholders and the Company at this time. An annual advisory vote allows the Board to receive timely, ongoing feedback from our shareholders. This assists the Board in taking shareholder views into account when considering changes to the executive compensation program. Additionally, an annual advisory vote is currently the standard desired by many shareholders.
Although this vote is non-binding, the Board values the opinions of the Company’s shareholders and will consider the outcome of the vote when making future decisions on the frequency of our Say on Pay proposals.
REQUIRED VOTE & RECOMMENDATION
While the Board recommends an annual advisory vote on executive compensation, shareholders may vote to hold the advisory vote on executive compensation each year, every two years or every three years.
Abstentions will not count as votes cast on this proposal, so abstentions will have no effect on the outcome. Broker non-votes will not be considered to have voted on this proposal, so will have no effect on the outcome.
The advisory vote on the frequency of holding the advisory vote on executive compensation is non-binding, therefore, our Board will not be obligated to take any actions or change the frequency as a result of the vote.
The Board recommends that you vote “FOR” holding the advisory vote on the compensation paid to our named executive officers with a frequency of “ONE YEAR”.
» What am I voting on?
We are asking our shareholders to ratify the selection of Deloitte & Touche LLP as the independent auditors of our consolidated financial statements and our internal controls over financial reporting for FY 2024.
» Voting recommendation:
FOR the ratification of the Audit Committee’s selection of Deloitte & Touche LLP
The Audit Committee has approved Deloitte & Touche LLP (“Deloitte”) to serve as our independent registered public accounting firmauditors for the 20222024 fiscal year. Deloitte was appointed on August 26, 2020. The Company did not engage Deloitte at any time during the two years before the appointment for any accounting-related matter. In the time since Deloitte’s appointment, Deloitte’s reports on the Company’s financial statements did not contain any adverse opinion or a disclaimer of opinion, nor was Deloitte’s opinion qualified or modified as to uncertainty, audit scope or accounting principles. Grant Thornton LLP (“Grant Thornton”) had served as the Company’s independent auditors from 2014 until their replacement on August 26, 2020 as the result of a competitive process. During that time, there were no disagreements between the Company and Grant Thornton on any matter of accounting principles or practices, financial statement disclosures or auditing scope or procedure. Also, during that time, Grant Thornton’s report on the Company’s financial statements did not contain any adverse opinion or a disclaimer of opinion, nor was it qualified or modified as to uncertainty, audit scope or accounting principles.
We are asking our shareholders to ratify the appointment of Deloitte as our independent registered public accounting firm.auditors. Although shareholder ratification is not required, the Board is submitting the proposal because we value our shareholders’ views on the Company’s independent auditorauditors and as a matter of good corporate practice. In the event that our shareholders fail to ratify the appointment, the Audit Committee will investigate the reasons and consider selecting a different firm. Even if the selection is ratified, the Audit Committee may select a different independent auditorauditors at any time during the year if it determines such a change would be in the best interests of the Company and its shareholders. A representative from Deloitte will be available at the Annual Meeting to, as requested, make a statement, speak with shareholders or respond to appropriate questions. PRE-APPROVAL POLICY
All services performed in FY 20212023 were pre-approved by the Audit Committee in accordance with the Audit Committee’s charter. The pre-approval policy requires the independent auditorauditors to submit an itemization of the services to be provided and fees to be incurred during the fiscal year. The Audit Committee approves the scope and timing of the external audit plan and focuses on any matters that may affect the scope of the audit or the independence of the independent auditor. In that regard, the Audit Committee receives certain representations from the independent auditorauditors regarding its independence and the permissibility, under the applicable laws and regulations, of any services provided. Once the initial audit plan has been approved, any requests for additional services or fees must be submitted to the Audit Committee for approval. These additional services may not commence until the Audit Committee reviews and approves the request. These requests for approval are normally evaluated during regularly scheduled Audit Committee meetings. However, if a request is submitted between meeting times, the Chair of the Audit Committee may approve the request pursuant to a delegation of authority. For the Chair of the Audit Committee, the approval authority is limited to services valued at less than $100,000. Any requests for services exceeding $100,000 must be approved by the full Audit Committee. If the Chair has exercised their approval authority, they must disclose all approval determinations to the full Audit Committee at the next regularly scheduled meeting. | | | | | | Relationship with Independent Registered Public Accounting Firm | | | | | | | 2021 PROXY STATEMENT | | | 27 | |
RELATIONSHIPWITH INDEPENDENT REGISTERED PUBLIC ACCOUNTING FIRM
The Audit Committee reviews all relationships between the independent auditor and the Company, including the provision of non-audit services. Deloitte has provided limited non-audit services during FY 2021to the Company related to tax compliance, and tax advisory and transaction due diligence services. The Audit Committee considered the effect of Deloitte’s non-audit services in assessing its independence. After discussion with Company management and Deloitte, the Audit Committee concluded that the provision of these services was permitted under the rules and regulations concerning auditor independence. INDEPENDENT AUDITOR’S FEES
Independent Auditor’s Fees |
The following table summarizes the aggregate fees for audit and non-audit services incurred by the Company. The Audit Committee pre-approved all of these audit and non-audit fees in accordance with the pre-approval policy described above. The fees for FY 2020 shown below were for Grant Thornton’s services, while the fees for FY 2021 were for Deloitte’s services. | Type of Fees | | | 2020 ($)* | | | | 2021 ($)* | | | Description | | FY 2022 ($)* | | | FY 2023 ($)* | | Description | | | | | | | | Fees for audit services performed during fiscal year 2020 consisted substantially of: auditing the Company’s annual financial statements, reviewing the Company’s quarterly financial statements, audit services in connection with the adoption of ASC 842 and audit services in connection with acquisitions and divestitures. | | | Audit Fees | | | 1,563,000 | | | | 1,371,000 | | | Fees for audit services performed during fiscal year 2021 relate to professional services rendered in connection with the annual audit of our consolidated financial statements and internal control over financial reporting; the reviews of the condensed consolidated financial statements performed in connection with each of our Quarterly Reports on Form 10-Q; and statutory audits required by foreign jurisdictions. | | 1,422,000 | | | 1,542,000 | | Fees for audit services performed during FY 2022 and FY 2023 relate to professional services rendered in connection with the annual audit of our consolidated financial statements and internal control over financial reporting; the reviews of the condensed consolidated financial statements performed in connection with each of our Quarterly Reports on Form 10-Q; and statutory audits required by foreign jurisdictions. | | Audit-Related Fees | | | 239,000 | | | | - | | | Fees for audit-related services performed during fiscal year 2020 consisted substantially of international statutory audit-related services in Germany, India, Ireland, Malaysia, Mexico, Portugal and the United Kingdom. | | - | | | 15,000 | | Fees for audit-related services in FY 2023 were for review of an SEC Comment Letter. | | | | | | | | Fees for tax services performed during fiscal year 2020 consisted substantially of tax assistance in Malaysia, Mexico, the Netherlands and Turkey. | | | Tax Fees | | | 21,000 | | | | 94,000 | | | For FY 2021, tax fees consist of fees billed for permissible professional services performed by Deloitte Tax LLP, an affiliate of Deloitte, for tax compliance, planning and advice. | | 34,000 | | | 28,000 | | Fees for tax services during FY 2022 and FY 2023 consisted of fees billed for permissible professional services performed by Deloitte Tax LLP and its global member firm affiliates, an affiliate of Deloitte, for tax compliance, planning and advice. | | All Other Fees | | | 1,000 | | | | - | | | Fees for all other services in 2020 represent agreed upon procedures performed by Grant Thornton in Ireland in connection with a government grant. | | 113,000 | | | 2,000 | | All other fees for FY 2022 related to transaction diligence services. All other fees for FY 2023 are for a subscription to an accounting research tool used for accounting and financial disclosures. | | Total Fees | | | 1,824,000 | | | | 1,465,000 | | | | | 1,569,000 | | | | 1,587,000 | | |
| | * | Amounts have been rounded to the nearest thousand.
| Amounts have been rounded to the nearest thousand. |
REQUIRED VOTE & RECOMMENDATION
| Required Vote & Recommendation |
Approval of this advisory proposal will require the affirmative vote of a majority of the votes cast in person or represented by proxy. Abstentions will not count as votes cast on this proposal, so abstentions will have no effect on the outcome. Broker non-votesnon- votes will be considered as a vote “FOR” this proposal. The Board recommends that you vote “FOR” the ratification of the appointment of Deloitte & Touche LLP as the Company’s independent registered public accounting firmauditors for the 20222024 fiscal year. | | | | | 28162023 Proxy Statement | | 2021 PROXY STATEMENT
| | |
GOVERNANCEGovernance
The purpose of corporate governance is to ensure that we maximize shareholder value consistent with a business model of integrity, ethical practices and compliance with all applicable law. As part of its duties to the Company, the Board monitors and oversees the proper safeguarding of the assets of the Company, the maintenance of appropriate financial and other internal controls and the Company’s compliance with applicable laws and regulations. Additionally, the Board monitors and oversees the governance practices of the CEO and senior management. In order to serve the best interests of shareholders while carrying out its purpose, the Board has established internal guidelines —guidelines— the Corporate Governance Guidelines — designed to promote effective oversight of the Company’s governance program and principles, beginning with the Board itself. You can access these materials by going to ir.standex.com and clicking on “Governance.” See page 7571for instructions on receiving copies of theseour corporate governance materials. 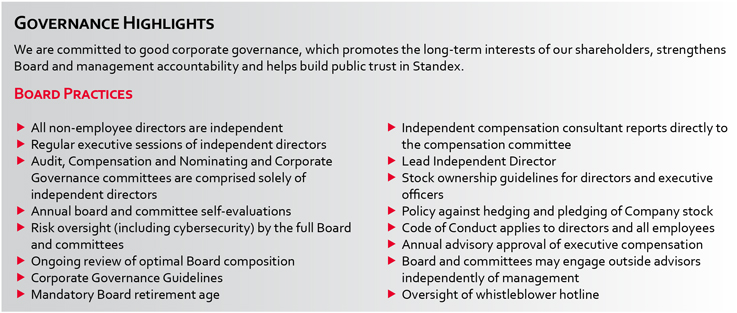
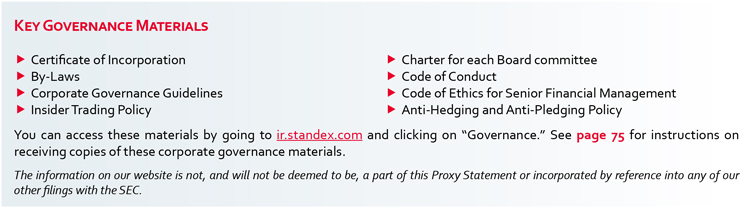
| | | | | | GovernanceHighlights We are committed to good corporate governance, which promotes the long-term interests of our shareholders, strengthens Board and management accountability and helps build public trust in Standex. Board Practices | | ► All non-employee directors are independent ► Regular executive sessions of independent directors ► All Board committees are comprised solely of independent directors ► Annual Board and committee self-evaluations ► Risk oversight (including cybersecurity) by the full Board and committees ► Ongoing review of optimal Board composition ► Independent compensation consultant reports directly to the compensation committee ► Lead Independent Director ► Corporate Governance Guidelines | ► Stock ownership guidelines for directors and executive officers ► Policy against hedging and pledging of Company stock ► SEC compliant clawback policy has been adopted ► Code of Conduct applies to directors and all employees ► Annual advisory approval of executive compensation ► Board and committees may engage outside advisors independently of management ► Oversight of whistleblower hotline ► Mandatory Board retirement age ► Periodic committee chair and membership rotations ► Oversight of ESG strategy and reporting | | | | Key Governance Materials | ► Certificate of Incorporation
► By-Laws
► Corporate Governance Guidelines
► Insider Trading Policy
► Clawback Policy | ► Charter for each Board committee
► Code of Conduct
► Code of Ethics for Senior Financial Management
► Anti-Hedging and Anti-Pledging Policy | You can access these materials by going to ir.standex.com and clicking on “Governance.” See page 71for instructions on receiving copies of these corporate governance materials. The information on our website is not, and will not be deemed to be, a part of this Proxy Statement or incorporated by reference into any of our other filings with the SEC. |
| | 2021 PROXY STATEMENT2023 Proxy Statement | | | 29 | 17 |
Board Leadership Structure |
BOARD LEADERSHIP STRUCTURE
The Board recognizes that one of its key responsibilities is to evaluate and determine its optimal leadership structure in order to best serve shareholders’ interests. To ensure an efficient and high-functioning board, in 2016, the Board elected our President and CEO, David Dunbar, to serve as Chair of the Board. In its determination that Mr. Dunbar should serve in this role, our Board examined several factors and believed that Board independence and management oversight were effectively maintained through the Board’s composition of independent directors, the committee system and a seasoned and engaged Lead Independent Director. A combined CEO and Chair role serves as an effective bridge between the Board and senior management and also provides strong unified leadership of the Company. Optimal Board leadership structure may change as circumstances warrant. The Board reviews its determination annually in accordance with the Corporate Governance Guidelines. This annual review allows the Board to maintain flexibility and promote the execution of the Company’s strategy, the independent oversight of senior management and the best interests of shareholders. In the event the Board determines that a different leadership structure is in the best interests of the Company and its shareholders, the Board will consider a change. Within the Board leadership structure are three distinct roles with specific duties and responsibilities. These duties and responsibilities are described below and are set forth in the Company’s By-Laws and Corporate Governance Guidelines. CHAIROFTHE BOARD
Chair of the Board u► | Presides over meetings of the Board. |
| ► | Presides over meetings of the Board.shareholders. |
u | | Presides over meetings of shareholders.
|
u | ► | Consults and advises the Board and its committees on the business and affairs of the Company. |
| ► | Performs such other duties as may be assigned by the Board. |
Chief Executive Officer | ► | In charge of the affairs of the Company, subject to the overall direction and supervision of the Board and its committees onand subject to such powers as reserved by the business and affairs of the Company. |
u | | Performs such other duties as may be assigned by the Board.
|
CHIEF EXECUTIVE OFFICER
Lead Independent Director u | | In charge of the affairs of the Company, subject to the overall direction and supervision of the Board and its committees and subject to such powers as reserved by the Board.
|
LEAD INDEPENDENT DIRECTOR
u | ► | Presides at all meetings of the Board at which the Chair of the Board is not present, including all executive sessions of independent directors. |
| ► | Encourages and facilitates active participation of all directors. |
| ► | Serves as a liaison between the independent directors and the Chair of the Board is not present, including all executive sessions ofon particular issues brought up by independent directors. |
u | ► | EncouragesCalls and facilitates active participationleads the executive sessions of allindependent directors.
|
u | ► | Serves as a liaison between the independent directors and the Chair ofLeads the Board on particular issues brought up by independent directors.discussions regarding the CEO’s annual evaluation and succession planning.
|
u | ► | CallsProvides feedback on information flow from management to the Board.
|
| ► | Available to advise committee chairs in fulfilling their designated roles and leads the executive sessions of independent directors.responsibilities. |
u | | Leads the Board discussions regarding the CEO’s annual evaluation and succession planning.
|
u | | Provides feedback on information flow from management to the Board.
|
u | ► | Available to advise committee chairs in fulfilling their designated rolesfor consultation and responsibilities.communication with shareholders, where appropriate and upon reasonable request. |
u | | Available for consultation and communication with shareholders, where appropriate and upon reasonable request.
|
u | ► | Performs such other functions as the Board or other directors may request. |
2021 PROXY STATEMENTBoard Committees
| | |
BOARD COMMITTEES
The Board maintains threefour Committees: | | | | | Audit | Compensation | Nominating & Corporate Governance | Innovation & Technology |

Only independent directors are eligible to serve on these Board committees.the Audit, Compensation and Nominating & Corporate Governance (“N&CG”) Committees. Each committee is governed by a written charter. To view the charters of the Audit Committee, Compensation Committee and Nominating and Corporate Governance (“N&CG”) Committee,these committees, please go to ir.standex.com, click on “Governance,” then “Committee Charters.” During FY 2023, the Board formally created the Innovation & Technology Committee. MEETING ATTENDANCEMeeting Attendance
Under our Corporate Governance Guidelines, directors have a duty to attend, whenever possible, all Board and committee meetings for committees on which the director serves. The Board held 76 meetings in FY 2021,2023, while the Committeescommittees of the Board held a total of 1517 meetings. Each director attended at least 75 % of the meetings of the Board and each of the committees on which such director served during FY 2021.2023. All Board members attended the Company’s 20202022 annual meeting of shareholders. The Company anticipates that all of the Board members will attend the 20212023 Annual Meeting. COMMITTEE STRUCTUREAND MEMBERSHIPCommittee Structure and Membership
Our Board designates Committee members and Chairs based on the N&CG Committee recommendations. The N&CG Committee recommended, and the Board approved, that all committee chairs and committee membership be periodically realigned in order to maintain a fresh perspective for each committee. For FY 2023, new chairs were appointed for each of the committees: Ms. Davenport (Audit); Mr. Hickey (Compensation); Ms. Edwards (N&CG); and Mr. Chorman (Innovation & Technology). Committee membership was also realigned. The following table shows the composition of each committee for FY 2021:2023: | | | | | | | | | | | | | | | Committee Memberships | | Name | A | C | A | | | | C | | | | N&CG | I&T | DAVID DUNBARDavid Dunbar
| |  |
| | | |
| | | |
| | MICHAEL A. HICKEYINDEPENDENTCharles H. Cannon, Jr. Independent
| | |
 | | | |
| | CHARLES H. CANNON, JR. INDEPENDENTThomas E. Chorman Independent
| | |
| | | |
| | | |
| | JEFFREY S. EDWARDSINDEPENDENTRobin J. Davenport Independent
|  | |
| | | |
| | | |
| | B. JOANNE EDWARDSINDEPENDENTJoanne Edwards Independent | | |
| | | |
| | | |
| | THOMAS E. CHORMANINDEPENDENTJeffrey S. Edwards Independent
| | |
| | | |
| | | |
| | THOMASThomas J. HANSENINDEPENDENTHansen Independent
| | |
| | | Michael A. Hickey Independent | | |
| | | |
| |
| | | | | A Audit Committee | | N&CG Nominating & Corporate
| | Chair | C Compensation Committee | | Chair | | N&CG Nominating & Corporate Governance Committee | I&T Innovation & Technology Committee | | Member |
| | | | 2021 PROXY STATEMENTAudit Committee
| | | 31 | | 2023 Members: | | | | Robin J. Davenport
(Chair) | Charles H. Cannon, Jr. Thomas E. Chorman Thomas J. Hansen | Independence: 1 4 out of 4 | Meetings held in 2023: 4 | | | | | | Key Responsibilities | | | | | | | |
| ► | Appointing, compensating, evaluating, retaining or terminating, as well as overseeing the independent auditors; | | ► | Reviewing matters pertaining to auditor independence and the provision of non-audit services; | | ► | Resolving disagreements between senior management and the independent auditors regarding financial reporting; | | ► | Reviewing and assessing the Company’s financial and accounting policies and procedures as well as the quality and accuracy of annual and quarterly financial statements; | | ► | Monitoring the establishment, maintenance and evaluation of the disclosure controls and procedures required by the SEC; | | ► | Reviewing programs instituted by the Company’s Internal Audit Department; | | ► | Reviewing identified risks and the mitigation measures taken by senior management; | | ► | Reviewing the CLO’s reports relating to litigation and compliance; | | ► | Overseeing the whistleblower procedures for reporting questionable accounting and audit practices and other matters that may be reported through the whistleblower hotline; and | | ► | Overseeing the integrity of metrics in the Company’s ESG program. | | | |
| 1 | The Board has determined that each member of the Audit Committee qualifies as an audit committee financial expert under SEC rules and has accounting or related financial management expertise and is financially literate for purposes of the NYSE corporate governance listing standards. The Board has also determined that each member of the Audit Committee meets the independence standards set forth in the SEC rules and required by the NYSE. |
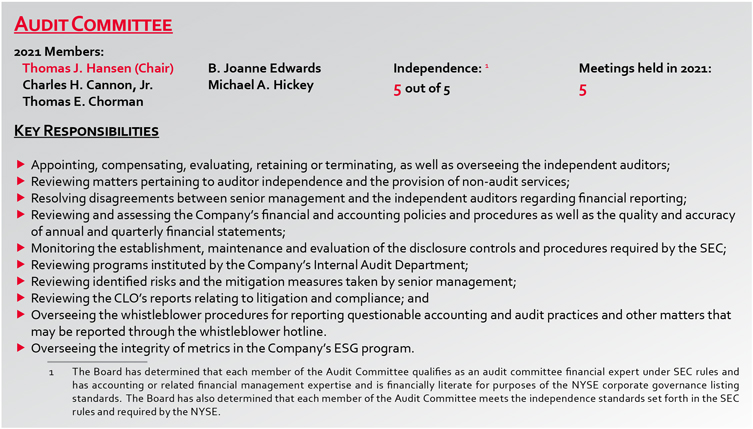
REPORTOFTHE AUDIT COMMITTEE
The Company’s internal controls and financial reporting are a multi-faceted undertaking, monitored and overseen by the Audit Committee. The Company’s management has the primary responsibility for the Company’s internal controls and financial reporting process. The independent auditors are responsible for performing an independent audit of the Company’s consolidated financial statements and reporting on the Company financial statements’ conformity with generally accepted accounting principles. Additionally, the independent auditors are responsible for providing an attestation on management’s assessment of the Company’s internal controls over financial reporting. The Audit Committee’s responsibility is to monitor and oversee all of these processes on behalf of the Board. This responsibility includes engaging the independent auditors, pre-approving their annual audit plan and reviewing their annual audit report. In this context, the Audit Committee has reviewed and discussed the consolidated financial statements with management and Deloitte. The Audit Committee has also reviewed management’s assessment of the effectiveness of the Company’s internal controls over financial reporting and Deloitte’s evaluation of these controls. The Audit Committee further discussed matters required to be discussed by the applicable requirements of the PCAOB and the SEC. Deloitte has provided to the Audit Committee the written disclosures and the letter required by the PCAOB and has discussed with the Audit Committee its independence from the Company and Company management. Finally, the Audit Committee considered whether Deloitte’s provision of non-audit services to the Company was compatible with maintaining its independence. Based on these reviews and discussions, the Audit Committee has recommended to the Board that the audited consolidated financial statements be included in the Company’s Annual Report on Form 10-K for the year ended June 30, 2021 for filing2023 which was filed with the SEC. Thomas J. Hansen, Chair
Charles H. Cannon, Jr.
Thomas E. Chorman
B. Joanne Edwards
Michael A. HickeySEC on August 4, 2023.

Robin J.
Davenport, Chair | 
Charles H.
Cannon, Jr. | 
Thomas E.
Chorman | | 
Thomas J.
Hansen
|
2021 PROXY STATEMENTCompensation Committee
| | | | | 2023 Members: | | | | Michael A. Hickey (Chair) Robin J. Davenport | B. Joanne Edwards
Jeffrey Edwards | Independence: 1 4 out of 4 | Meetings held in 2023: 5 | | | | | | Key Responsibilities | | | | | | | |
| ► | Retaining or terminating compensation consultants; | | ► | Reviewing and approving corporate goals and objectives regarding CEO compensation; | | ► | Recommending salary structures and compensation plans to the Board; | | ► | Reviewing and approving performance and operating goals under incentive plans for senior management; | | ► | Reviewing and approving senior management’s employment agreements, severance agreements and CIC agreements; | | ► | Recommending changes to non-employee director compensation to the Board; | | ► | Reviewing management’s Compensation Discussion and Analysis to be included in the Proxy Statement; and | | ► | Reviewing the results of the say-on-pay resolution and other input received from our shareholders on compensation practices. |
| | | 1 | The Board has determined that each member of the Compensation Committee meets the independence standards set forth in the SEC rules and required by the NYSE |
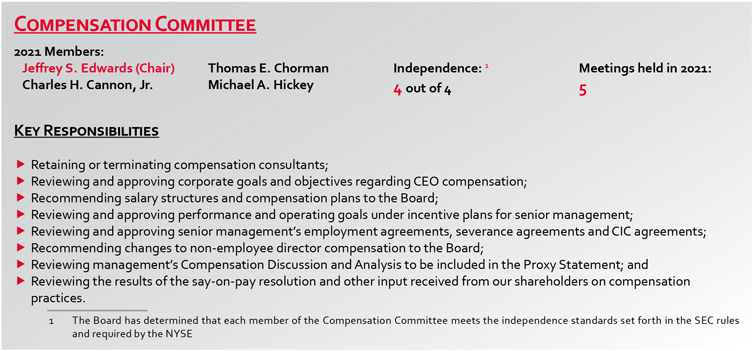
Under our long-term incentive plans, the Compensation Committee may delegate some decision-making authority regarding awards to the CEO. This authority is limited to granting and approving awards for designated individuals, as long as such individuals are not officers of the Company, as determined by the Board, or directly report to the CEO. Currently, the Compensation Committee has delegated authority to Mr. Dunbar to grant such awards subject to a pool limit authorized by the Committee. The Compensation Committee has not delegated any of its other authority to any individual. 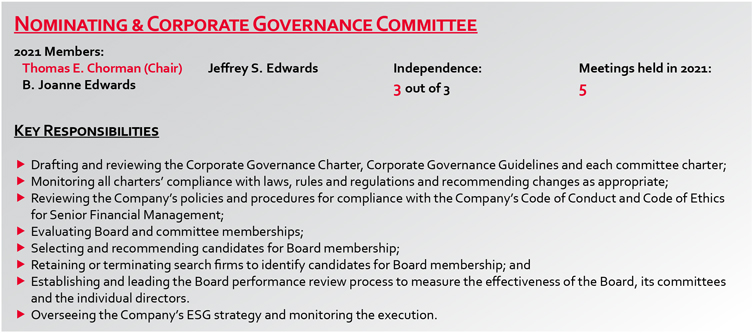
The report of the Compensation Committee can be found on page 53at the end of the Compensation Discussion & Analysis. | | | | | | | | | Nominating & Corporate Governance Committee | |
| | 2021 PROXY STATEMENT2023 Members:
| | | 33 | B. Joanne Edwards (Chair) Charles H. Cannon, Jr. | Thomas E. Chorman
Jeffrey S. Edwards
Michael A. Hickey | Independence: | Meetings held in 2023: | | | | | | | | | | | | |
| ► | Drafting and reviewing the Corporate Governance Charter, Corporate Governance Guidelines and each committee charter; | | ► | Monitoring all charters’ compliance with laws, rules and regulations and recommending changes as appropriate; | | ► | Reviewing the Company’s policies and procedures for compliance with the Company’s Code of Conduct and Code of Ethics for Senior Financial Management; | | ► | Evaluating Board and committee memberships; | | ► | Selecting and recommending candidates for Board membership; | | ► | Retaining or terminating search firms to identify candidates for Board membership; | | ► | Establishing and leading the Board performance review process to measure the effectiveness of the Board, its committees and the individual directors; and | | ► | Overseeing the Company’s ESG strategy and monitoring the execution. |
REPORTOFTHE NOMINATINGReport of the Nominating & CORPORATE GOVERNANCE COMMITTEECorporate Governance Committee
The duties and responsibilities of the Nominating and Corporate Governance Committee are broad. The N&CG Committee operates pursuant to the Corporate Governance Charter. In fulfilling the responsibilities and duties contained therein, the N&CG Committee actively reviews all Board principles, guidelines and charters. The N&CG Committee also maintains responsibility for overseeing senior management’s compliance with the Code of Conduct and Code of Ethics for Senior Financial Management. The N&CG Committee further identifies and evaluates candidates for Board membership, evaluates Board committee membership and recommends Company employees for election to Company officer roles. The N&CG Committee is also responsible for overseeing the Company’s ESG strategy. Lastly, the N&CG Committee establishes and maintains a Board performance review process and recommends changes to the Board based on the review. BOARD SELF-ASSESSMENTBoard Self-Assessment & SKILLS MATRIXSkills Matrix
The N&CG Committee has developed and implemented a prescribed self-evaluation process to assess the configuration and enhance the functionality of the Board and each of its committees. This process identifies current Board members’ attributes, expertise and experiences and creates a skills matrix, which is used to identify areas of improvement within Board structure and committee configuration. The self-evaluation is instrumental in evaluating the future needs of the Board in relation to the Company’s strategic goals and identifying the qualifications that a future candidate should have to aid in the achievement of those strategic goals. The matrix shown below details the skills that are evaluated, a description of those skills and how many Board members and nominees are proficient in a particular skill. 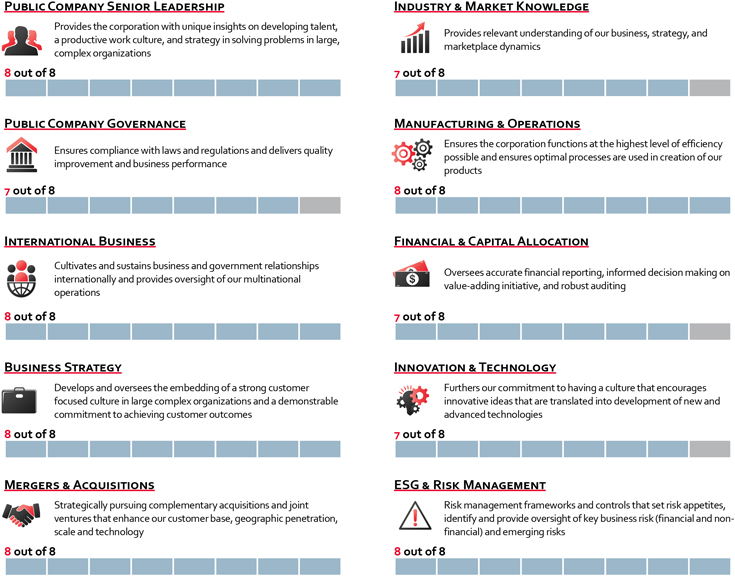
| | | | | 34Public Company Senior Leadership | | Industry & Market Knowledge |  | 2021 PROXY STATEMENTProvides the corporation with unique insights on developing talent, a productive work culture, and strategy in solving problems in large, complex organizations
| |  | Provides relevant understanding of our business, strategy, and marketplace dynamics | | 8 out of 8 | | 7 out of 8 |  | |  | | | | | | | Public Company Governance | | Manufacturing & Operations |  | Ensures compliance with laws and regulations and delivers quality improvement and business performance | |  | Ensures the corporation functions at the highest level of efficiency possible and ensures optimal processes are used in creation of our products | | 7 out of 8 | | 8 out of 8 | | | | | | | | | | International Business | | Financial & Capital Allocation |  | Cultivates and sustains business and government relationships internationally and provides oversight of our multinational operations | |  | Oversees accurate financial reporting, informed decision making on value-adding initiative, and robust auditing | | 8 out of 8 | | 7 out of 8 | | | | | | | | | | Business Strategy | | Innovation & Technology |  | Develops and oversees the embedding of a strong customer focused culture in large complex organizations and a demonstrable commitment to achieving customer outcomes | |  | Furthers our commitment to having a culture that encourages innovative ideas that are translated into development of new and advanced technologies | | 8 out of 8 | | 7 out of 8 | | | | | | | | | | Mergers & Acquisitions | | ESG & Risk Management |  | Strategically pursuing complementary acquisitions and joint ventures that enhance our customer base, geographic penetration, scale and technology | |  | Risk management frameworks and controls that set risk appetites, identify and provide oversight of key business risk (financial and non-financial) and emerging risks | | 8 out of 8 | | 8 out of 8 | | | |
Identifying and Evaluating Candidates for Board MembershipIDENTIFYINGAND EVALUATING CANDIDATESFOR BOARD MEMBERSHIP
The N&CG Committee is responsible for recommending candidates for Board membership when the N&CG Committee has identified a need to add new members or when there is a vacancy. The N&CG Committee has not established specific,Rather than establishing minimum qualifications, for director nominees. However, the N&CG Committee strives to find candidates whose skills complement the needs presented by the global, multi-sector, engineered manufacturing operations of the Company and whose skills include analytical financial expertise and strategic planning. Candidates must also possess characteristics, such as integrity and sound judgment, that would enable the Board to function cohesively and effectively. The N&CG Committee also evaluates whether a particular candidate has the capacity and desire to make a significant time commitment to serving on the Board. Finally, the Committee focuses on prioritizing the identification of candidates with gender, ethnic and racial diversity who will lend nuanced perspectives to Board discussions. To identify such candidates, the N&CG Committee has the authority to retain a third-party search firm and to consider suggestions from directors, shareholders and management. The N&CG Committee ensures that the pool of candidates reflects a range of professional experience and expertise as well as diversity of gender, race and ethnicity by instructing the search firm to seek out and present diverse candidates who may expand the perspectives of the Board. The N&CG Committee views diversity expansively and considers depth and breadth of relevant business experience, leadership performance and strategic acumen alongside other immutable characteristics that a candidate may possess. The N&CG Committee reviews and evaluates each candidate by taking into account all available information concerning the candidate. All candidates, whether identified by a third-party search firm, the directors, management or shareholders, are evaluated based on the same criteria. The candidates must also fit within the existing composition of the Board to be recommended to the Board as a prospective nominee. In the FY 2020 Proxy Statement, the Board committed to adding another female to the Board; Robin J. Davenport is nominated herein for election. Shareholders may submit recommendations for future candidates by notifying the N&CG Committee, in writing, and shareholders may submit direct nominations for inclusion in the Company’s Proxy Statement using the processprocesses described under “How Can I Submit a Shareholder Proposal or Director Nomination?” on page 7470. Please attach any appropriate supporting materials. Shareholders may submit direct nominations for inclusion in the Company’s Proxy Statement by following the process described under “How Can I Submit a Shareholder Proposal or Director Nomination?” on page 74. CODEOF CONDUCTAND CODEOF ETHICSFOR SENIOR FINANCIAL MANAGEMENT
Management has the primary responsibility for creating, maintaining and administering programs to ensure employees’ compliance with the Code of Conduct and the Code of Ethics for Senior Financial Management, (the “Codes”), both of which are available by going to ir.standex.com, clicking on “Governance,” and then clicking on “Policies.” The N&CG Committee routinely receives updates from the Corporate Governance Officer on the existing programs and any proposed programs. On an annual basis, employees are presented with a copy of the Code of Conduct and must affirm their compliance with it.
The Company also utilizes an online interactive compliance training program to educate employees on the Codes as well as other regulatory and workplace compliance topics. Employees are assigned training modules on a regular basis to promote ongoing awareness of ethics issues. The Company divisions routinely customize the modules to address ethics issues specific to their organizations.
The N&CG Committee is also responsible for evaluating and approving requests for waivers of the Codes. Any request must be submitted, in writing, to the Chair of the N&CG Committee, who then reports the submission to the whole N&CG Committee. The N&CG Committee then provides their recommendation on the request to the Board. Any waivers granted to executive officers are disclosed to shareholders as soon as practicable via the Company’s website. No waivers have been granted during FY 2021 or during any prior period.
Additionally, a third-party global, multi-language hotline is available 24/7 at every Company location worldwide, for anonymous reporting of financial, accounting, auditing or other employee concerns. This communication tool is a beneficial outlet for employees to express concerns. During FY 2021, the Corporate Governance Officer engaged in a compliance check to ensure that (i) hotline posters were prominently placed in each global location, in the local language and that (ii) the international dialing codes provided access to the hotline. The Company continues to believe that all employees across the globe should and do have full access to this communication and reporting tool.
Thomas E. Chorman, Chair
B. Joanne Edwards
Jeffrey S. Edwards
| | Innovation & Technology Committee | | | | 2021 PROXY STATEMENT2023 Members:
| | | 35 | Thomas E. Chorman | Michael A. Hickey | Independence: | Meetings held in 2023: | | | | | | | | | | | | |
| ► | Reviewing, advising and providing oversight on the strategic plan for technology and innovation; | | ► | Liaising with senior management regarding significant growth opportunities; | | ► | Evaluating the risks and opportunities associated with proposed material investments in innovation and technology; | | ► | Assessing the impact of significant innovation and new technology projects on business, growth prospects and strategy; | | ► | Advising, monitoring, assessing and making recommendations on technology partnerships, joint ventures and collaborations; and | | ► | Advising and making recommendations regarding potential M&A transactions that center around key innovations, opportunities or gaps in the technology portfolio. |
KEY AREASOF BOARD OVERSIGHTStrategy and Risk Oversight |
The key responsibilities of the Board, as a whole, include oversight of business strategy; succession planning for the CEO and for senior management; oversight of compliance; oversight of risk management; and oversight of ESG strategy and initiatives.initiatives; oversight of cybersecurity; oversight of human capital management; and oversight of compliance. STRATEGYOversight of Strategy
Oversight of the Company’s business strategy and strategic planning is a key responsibility of the Board. The Board believes that overseeing and monitoring strategy is a continuous process - one that involves constant assessment to ensure that Company performance in the short and in the long term are consistent with creating and maximizing shareholder value. The Company’s management, on the other hand, areis tasked with executing the business strategy. The Board receives regular updates and actively engages with senior management to monitor execution of the business strategy. SUCCESSION PLANNING
The Board believes that oneOversight of its primary responsibilities is to oversee the development and retention of senior talent and to ensure that an appropriate succession plan is in place for our CEO and other members of senior management. To this end, the Board undergoes an annual review process with the CEO, members of senior management, as well as division leaders, to develop, evaluate and make adjustments to succession plans.Business Risks
RISK
The CEO and other members of senior management are primarily responsible for managing the risks the Company faces. Our Enterprise Risk Management process is driven by our Corporate Governance Officer (a senior member of our internal legal department), in cooperation with the Company’s Director of Internal Audit, risk management department, CFO and other members of senior management. Risks are assessed and categorized in order to put in place appropriate mitigation plans. Risk factors are reviewed and rated according to their likelihood of occurrence, financial and intangible impact if occurrence took place, and velocity (how quickly the risk could affect the business). Mitigation plans are developed for the top identified risks. These risk assessments and mitigation plans are presented annually to the full Board for review and discussion. The Board’s responsibility regarding risk management is to oversee the Company’s risk management policies and procedures and provide guidance on the overall effectiveness of thethese policies and procedures. To fulfill this responsibility, the Audit Committee receives reports, on a quarterly basis, regarding the risks that have been identified and the measures that are being taken. Additionally, the Audit Committee receives reports on a regularly scheduled quarterly basis, presented by our Corporate Governance Officer and our Chief Legal Officer regarding material litigation, legal loss contingencies and calls received on our whistleblower hotline. The Board is regularly informed through the Audit Committee’s reports and through direct communications from senior management. The Board and each committee’s risk oversight roles, as provided in their respective charters, are evaluated on an annuala period basis to determine whether the risk oversight responsibilities are being discharged effectively. TheWith the addition of the Innovation & Technology Committee at the beginning of FY 2023, that committee assumed responsibility for overseeing risks associated with investments in new technology and innovation. With this enhancement, the Board undertook this evaluation in FY 2021 and foundbelieves that changing the current structureallocation of risk oversight was not warranted. Otheramong its committees remains appropriate and enables the Board to discharge its risk oversight responsibilities effectively. For a description of risk factors facing the Company, are described insee the Annual Report on Form 10-K, filed on August 13, 2021,4, 2023, under the Part I Section entitled “Item IA. Risk Factors.” 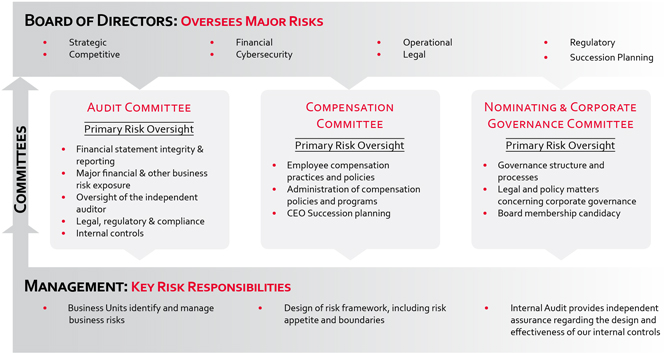
Our Enterprise Risk Management process is a cooperate process involving the legal, internal audit and risk management departments, along with the CFO and other members of senior management. Risks are assessed and categorized in order to put in place appropriate mitigation plans. Risk factors are reviewed and rated according to their likelihood of occurrence, financial and intangible impact if occurrence took place, and velocity (how quickly the risk could affect the business). Mitigation plans are developed for the top identified risks. These risk assessments and mitigation plans are presented annually to the full Board for review and discussion. 2021 PROXY STATEMENTESG Strategy & Risks
|
We have formalized responsibility for oversight of our ESG program with two of our Board committees. Our Board’s N&CG Committee maintains responsibility for oversight of our ESG strategy, while the Audit Committee is responsible for oversight of the integrity of those ESG related metrics that we publicly disclose. Both of these committees provide pertinent updates to the full Board. A management-level ESG Council has responsibility for implementing the Company’s ESG strategy and reporting on its effectiveness and accomplishments. The Chair of this ESG Council provides an update to the N&CG Committee at each of its regularly scheduled meetings, while the Company’s internal audit function reports to the Audit Committee on processes for auditing the integrity of ESG disclosures. The information contained herein outlines our approach to ESG and also highlights some of the key facets of our ESG programs. Additional information can also be found on our website at www.standex.com, by clicking on “Sustainability.” Responsible Business Practices We conduct our business fairly and ethically and in a manner consistent with all applicable legal and industry code requirements. Strict compliance, high standards of ethical conduct and a strong values-based corporate culture define how we operate in our work environment, business practices and relationships with external stakeholders. Human Rights Standex is committed to high standards of integrity, ethics and sustainability throughout our operations and supply chain. We support human rights, labor rights and anti-slavery in our own operations and within our supply chain. We are committed to respecting all internationally recognized human rights standards, including the rights and principles set out in the UN Universal Declaration of Human Rights and the ILO Declaration on Fundamental Principles and Rights at Work. Our Supplier Code of Conduct explicitly requires all suppliers who currently do business with us, or seek to do business with us, to not engage in any activities that violate human rights or labor rights. Our Human Rights Policy and Supplier Code of Conduct can be found at: ir.standex.com/policies. Anti-Corruption Standex conducts business honestly, fairly, ethically, free from corruption and in a manner consistent with all applicable legal and industry standards. We do not engage in or tolerate bribery or corruption of any kind. We require our employees, suppliers and other business partners to comply with all applicable anti-bribery and anti-corruption laws through our Code of Conduct, Supplier Code of Conduct and our Gifts & Gratuities Policy. We also regularly employ compliance training on these topics to ensure our employees are aware of prohibited practices and the legal requirements. Political Activities & Lobbying Our Code of Conduct prohibits the use of company funds, assets, property or personnel to contribute to or support political campaigns. Standex, as a company, generally does not engage in any political lobbying. Standex is, however, a member of the various organizations, such as the National Association of Manufacturers, which does periodically lobby in the interests of its members as a whole. Community Outreach Standex CARES is the Company’s community partnership program, which provides our employees the opportunity for service leadership and engagement. CARES stands for Connect, Act, Reach, Engage and Serve. In our vision statement, we commit to “encourage a culture of giving that is a way of life at Standex, extending beyond the walls of our facilities through engagement in our communities and dedicated partnerships that reflect the spirit of our employees.” We execute this vision through our mission statement, in which we “pledge to support local programs that benefit our communities through the four key areas of education, workforce readiness, humanitarian relief, and community engagement to improve the lives of people in our communities.” Environment, Sustainability & Climate We share the same world, and it is our priority to bring sustainable practices to our business operations. We are continuing our evolution to improve recycling, increase energy efficiency, reduce waste and improve processes. We are actively seeking, and using, alternatives to critical mineral raw materials that are mined, and we continuously monitor our supply chain to ensure transparent and ethical sourcing. In FY 2022, we began measuring, on a global basis, the following metrics in order to set a baseline against which improvement can be measured: In FY 2023, we set reduction targets for the foregoing metrics. For more information, please see: standex.com/environment/.
Climate We believe that focused and sustained action is required to address climate change and its implications. We recognize that climate change poses risks to businesses, industries, and broader society. As part of our commitment to operate sustainably, we are taking action to understand climate-related risks and opportunities. We have embedded climate change risks into our Enterprise Risk Management process, and both risks and opportunities into our business strategy planning process at all of our divisions. We have also incorporated energy and waste reduction into the strategic goals for key operations leaders. During FY 2023, we completed analysis of our Scope 1 and Scope 2 greenhouse gas (“GHG”) emissions globally, and we are working toward the adoption of science based GHG reduction targets. We are mindful that the transition to a low carbon global economy will require deep collaboration at many levels. We will continue to collaborate with our customers, suppliers and partners to find innovative approaches to minimizing the collective impact we have on the environment. Responsible Sourcing Standex is committed to high standards of integrity, ethics, and sustainability throughout our supply chain. To this end, we have been evolving a robust responsible sourcing initiative. The critical components to this initiative include our Supplier Code of Conduct, our Conflict Minerals Program, and the work of our Responsible Sourcing Council.
Cybersecurity & Data PrivacyCYBERSECURITYCybersecurity
Protecting our digital assets and the security of our information systems is a top priority for us. Historically, the nature and scope of our IT applications and systems was almost as diverse as the array of companies that comprised the Standex portfolio. With our transformation into a more focused, high performance operating company however, over the past several years, we have been rationalizing and standardizing our approach to IT. As a critical component of this effort, we have improved and continue to enhance our IT security controls and protocols. While management has oversight of cybersecurity execution, the Board and the Audit Committee regularly oversee the general cybersecurity strategy and the efficacy of IT controls. To this end, during FY 2021, a Chief Information Officer (CIO) was appointed for the Company. The CIO overseesDirector of IT, Security and implements the Company’s IT strategy and, with respect to IT security,Compliance is responsible for ensuring the effectiveness of access and security controls, the deployment and use of effective security tools, applications and policies and the training of all employees on applicable IT policies and procedures. The CIODirector of IT, Security and Compliance periodically presents to the Board on the status of and plans for IT security. During
In FY 2021,2022, we took several stepsenhanced our cybersecurity training for all employees with computer access. We have also periodically launched targeted e-mails simulating phishing attacks to educate our employees and address potential vulnerabilities. We also implemented managed endpoint detection and response. In FY 2023, we continued our focus on cybersecurity training and made further enhancements to our privileged permissions management. Data Privacy We value the right to privacy of our employees, customers and business partners. We are committed to protecting the information we receive by collecting, processing, storing, transmitting and using the data in a lawful manner, consistent with legitimate business reasons. Our employees undergo continuous training on data privacy. Business risks and opportunities related to data privacy and cybersecurity are evaluated annually as part of our Enterprise Risk Management process. Human Capital Management Culture & Employee Engagement Standex is committed to creating and sustaining a culture built on mutual respect, inclusion, trust and transparency where employees feel valued and supported for the unique people they are, the skills and experiences they bring to the table and the contributions they make. We believe building a great culture is the foundation for cultivating successful relationships with our employees, customers, shareholders and communities. On an annual basis, Standex engages with a third party to conduct a global culture survey in which all employees can participate. Results from the survey provide the Company with employee feedback that is used to define, develop and measure culture actioning plans at the Corporate, Business Segment and site level. Our culture survey process helps us attract, retain and develop talent, instill a continuous improvement mindset and discipline across the Company; develop processes and systems that facilitate and support achievement of our strategic goals and objectives; and cultivate a working environment where our employees feel valued and have opportunities to grow and contribute. In FY 2023, the annual Culture Survey was sent to all 4,000 of our employees in seventeen languages. There was an 82% response rate, representing an 8% increase from FY 2022, with a total of 9,300 responsive comments. The results of the Culture Survey were evaluated at the Company, business, region and site location level and were assessed against an external aspirational benchmark. In the spirit of transparency and continuous improvement, Company level results were shared during the Company’s Q3 All Employee Webcast and on the Company's internal intranet, and business segment results were shared with those segment employees. The Company has initiated two concurrent tracks of actioning relative to addressing opportunities for improvement. The “centralized” track focused on actioning the top areas of greatest organizational impact for the Company, initiated by the senior leadership team of Standex, inclusive of corporate officers and business segment presidents. This process included incorporating areas of focus into the Company’s FY 2023 Corporate Strategic Goals. The “local” track focused on business segments, functions and sites independently actioning the top areas of greatest impact unique to their specific survey results. All business segments were required to develop an actioning plan to focus on priority opportunities for improvement specific to their business and to each facility. Progress against goals is reviewed during the Company’s formal quarterly business reviews. Succession Planning & Talent Development The Board believes that one of its primary responsibilities is to oversee the development and retention of senior talent and to ensure that an appropriate succession plan is in place for our CEO and other members of senior management. To this end, the Board undergoes an annual review process with the CEO and senior management to develop, evaluate and make adjustments to succession plans. Our talent strategy is focused on attracting and retaining the best talent, recognizing individual and team contributions and investing in the ongoing development of our employees at all levels and at every stage of their careers. We are an organization that values continuous learning and personal development. In furtherance of the foregoing, we maintain a formal management development program pursuant to which we deliver customized in person training courses to high potential employees. In FY 2023, the curriculum was expanded and delivered to our L3 and L4 managers (direct reports of business segment leadership teams) in North America and Europe. All of our employees also undergo annual performance management and development reviews. Diversity, Equity & Inclusion We are committed to ensuring that Diversity, Equity and Inclusion (“DE&I”) is a top priority across our global organization. For us, DE&I begins first with valuing every employee for the unique individual they are and the skills and experiences they bring to Standex. We strive to create an environment where people feel welcomed and appreciated for the contributions they make every day. We prohibit any form of discrimination, harassment or intolerance and we train employees to understand and recognize these issues. We have policies and processes to address reports of such behavior, including an anonymous hotline managed by an external third party, which reports to our Corporate Governance Officer. We maintain an Inclusion Advisory Council (“IAC”) to function as a collective advisor to the senior leadership team, the business unit leadership teams and the global human resources community, with a primary focus on identifying goals and actions to increase inclusivity and continue building a listening culture. The IAC consists of employees, at all levels, from every reporting business segment, from all over the globe and from a variety of functional areas (corporate, finance, human resources, management, and production). In FY 2023, the IAC started the Company's first Employee Resource Group (“ERG”), the Women and Leadership ERG. This ERG has executive sponsorship by our Scientific segment President and consists of approximately 50 women and allies at all levels from all over the globe. The goal of starting voluntary, employee-led ERGs at Standex is to foster a diverse, inclusive workplace and build a sense of community. Employee Wellbeing We view employee wellbeing as a key component of a strong corporate culture. Our programs have historically included free smoking cessation programs, on-site biometric screenings, health and diet coaching, subsidized gym memberships and flu shots. Providing our employees with the tools to improve their wellbeing – not just physical wellbeing, but also mental, emotional and financial wellbeing – is of paramount importance. We partner with Virgin Pulse, a nationally recognized wellness partner, to enhance our cybersecurity program to address ever evolving cybersecurity risks. employee wellness offerings. Employee Communication We alsonow have various initiatives underway to further enhancea unified voice and brand platform with the efficacylaunch of our IT securitynew corporate website, standex.com. The site draws new users daily, amplifying our vision, our businesses and controls. Please referour culture and serving as a beacon for existing employees and a recruiting tool. Internally, Standex Exchange, our digital communication platform is advancing the shift to a cohesive communications ecosystem. The platform empowers customized employee communication and facilitates a robust two-way dialogue that allows us to gather valuable insights. This open communication is a key component to the communication strategy focused on continually strengthening engagement, boosting productivity, and fortifying employee retention. Safety Employee safety is a long-standing, top priority. Responsibility and accountability reside with each employee and fosters a spirit of community co-dependence. Monthly safety calls with the Company CEO emphasizes this principle. All locations across the globe are subject to the same standards. Since the beginning of 2020, our website, www.standex.com/corporate-responsibility/information-data-security for more information. COVID-19 RESPONSE
global TRIR has consistently been at or below world class levels of achievement that our employees have diligently pursued. Our servicefootprint is global, and manufacturing facilities are located in 24 countries. We are proudwe continue to be aware of, and focus on, the change that we can affect when we focus on improvements to all of our employees, who worked diligently to keep our locations open as critical, essential manufacturers, serving infrastructure, medicalworldwide facilities and supply chain industries that are responding to the global pandemic. We were able, with very few exceptions, to keep all locations fully open during the entire duration of the COVID-19 pandemic. COVID-19 continues to be a part of our operational planning and response.work practices. To ensure consistent policies and procedures during the pandemic, a COVID-19 leadership task force developed resources for our businesses to use, along with written processes implementing all public health recommendations. The task force was available at all times to respond immediately to reports of potential employee infection, and to form action plans. Frequent global calls, during which all businesses shared best practices and practical guidance, helped our businesses support each other and manage through the pandemic. As the pandemic has evolved during FY 2021, the Company has also pivoted, following all public health guidance and encouraging vaccines for all eligible employees.
Other Risk and Governance Matters |
We recognize the value of good health for our employees, their families and our communities. Our principal focus during the COVID-19 crisis was the health and safety of our people across the globe. We continue to communicate daily with our business locations to monitor safe practices and the ability to continue serving our customers.Compliance
COMPLIANCE
We view compliance with applicable laws and regulations as a foundational minimum for ethical business practices. The Board oversees our compliance policies and procedures to ensure the effective performance of management’s duties. Having our Code of Conduct apply to all employees globally, as well as the Board, sends the message that we are all committed to doing the right thing. Our specific compliance policies detail the ethical framework found in the Code of Conduct. Together, these compliance efforts assure that we act effectively and efficiently in the best interests of shareholders. ENVIRONMENT, SOCIAL & GOVERNANCE
We have formalizedCode of Conduct and Code of Ethics for Senior Financial Management
Management has the primary responsibility for oversightcreating, maintaining and administering programs to ensure employees’ compliance with the Code of our ESG program with twoConduct and the Code of our board committees. Our Board’sEthics for Senior Financial Management, (the “Codes”), both of which are available by going to ir.standex.com, clicking on “Governance,” and then clicking on “Policies.” The N&CG Committee maintains responsibility for oversightroutinely receives updates from the Corporate Governance Officer on the existing programs and any proposed programs. On an annual basis, employees are presented with a copy of our ESG strategy, while the AuditCode of Conduct and must affirm their compliance with it. The Company also utilizes an online interactive compliance training program to educate employees on the Codes as well as other regulatory and workplace compliance topics. Employees are assigned training modules on a regular basis to promote ongoing awareness of ethics issues. The Company divisions routinely customize the modules to address ethics issues specific to their organizations. The N&CG Committee is also responsible for oversightevaluating and approving requests for waivers of the integrity of those ESG related metrics that we publicly disclose. BothCodes. Any request must be submitted, in writing, to the Chair of the N&CG Committee, who then reports the submission to the whole N&CG Committee. The N&CG Committee then provides their recommendation on the request to the Board. Any waivers granted to executive officers are disclosed to shareholders as soon as practicable via the Company’s website. No waivers have been granted during FY 2023 or during any prior period. Additionally, a third-party global, multi-language hotline is available 24/7 at every Company location worldwide, for anonymous reporting of financial, accounting, auditing or other employee concerns. This communication tool is a beneficial outlet for employees to express concerns. Conflicts of Interest The Code of Conduct requires that all directors, executive officers and employees avoid engaging in any activity that might create a conflict of interest. All individuals are required to report any proposed transaction that might reasonably be perceived as creating a conflict of interest to their supervisor and/or the CLO. During the past fiscal year and for all prior periods, there have not been any reports of such transactions. Related Party Transactions The Board has adopted a written policy for the review of certain related party transactions between any director, director nominee, executive officer, beneficial owner of more than 5% of any class of the Company’s securities, or any immediate family member of any of the foregoing (any of the foregoing being a “Related Party”) and the Company. For purposes of the policy, a “related party transaction” is any transaction, arrangement or relationship in which (a) the aggregate amount involved will or may be expected to exceed $120,000 in any fiscal year; (b) the Company or any subsidiary is a participant; and (c) any Related Party has or will have a direct or indirect material interest. This policy is administered by the Audit Committee, provide pertinent updates towhich will only approve a related party transaction if it is, in its judgment, not inconsistent with the full Board. A management-level ESG Steering Committee has responsibility for implementing the Company’s ESG strategy and reporting on its effectiveness and accomplishments. This ESG Steering Committee provides an update to the N&CG Committee at each regularly scheduled meetingbest interests of the Committee.Company and its shareholders. The Audit Committee may, in its sole discretion, impose such terms and conditions as it deems appropriate in connection with its approval. No director may participate in the discussion or approval of a transaction in which that director, or their immediate family member, has a direct or indirect interest.
As our ESG Strategy matures into the establishment of specific goals
When a related party transaction is ongoing and the reporting of achievement against these goals, the ESG Steering Committee will periodically review withhas been approved by the Audit Committee, the processes for measuring such achievements. The Audit Committee also will receive input fromannually review the Company’s internal audit function ontransaction and determine if it is in the integrity of such processes. The information contained on the following pages outlines our approach to ESG and also highlights somebest interests of the key facets of our ESG programs. Additional information can also be found on our website at www.standex.com, by clicking on “Environment, Social & Governance.”Company and its shareholders to continue, modify or terminate such transaction.
Since July 1, 2022, there has not been, nor is there currently proposed, any related party transaction. | | | | | | | | | 302023 Proxy Statement | | | | 2021 PROXY STATEMENT | | | 37 | |
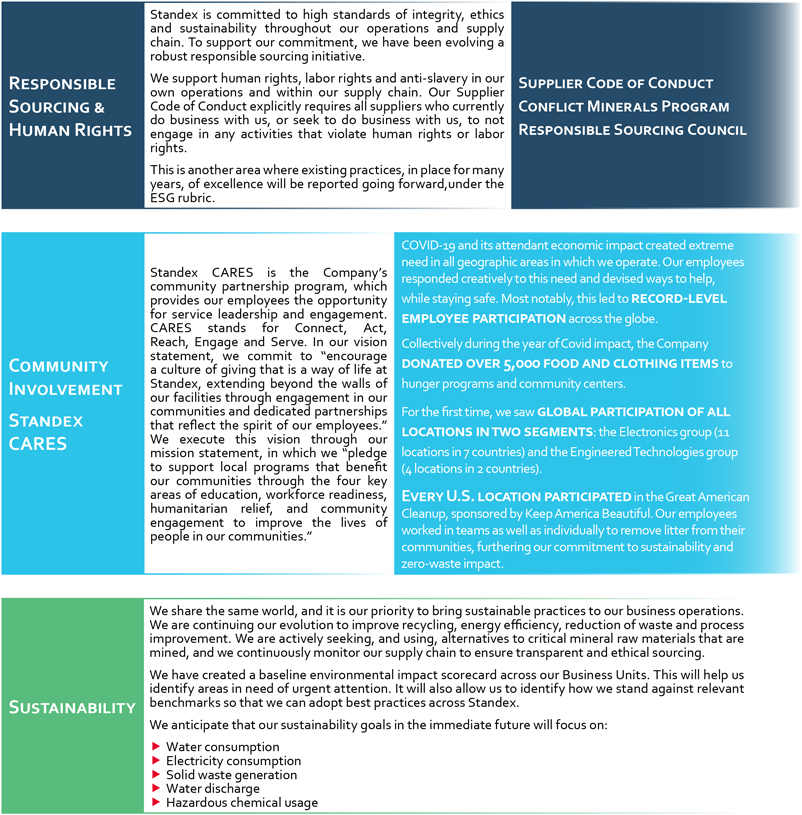

ADDITIONAL GOVERNANCE MATTERS
ANTI-HEDGINGAND ANTI-PLEDGING POLICIES
The Company’s anti-hedging and anti-pledging policy prohibits all officers, directors andany officer, director or key employees from engaging in certain transactions involving the Company’s securities. Specifically, officers, directors and key employees are prohibitedemployee from engaging in the following transactions involving Companythe Company’s securities: | | u► | short-term trading, defined as selling Standex stock within six months of purchasing Standex stock on the open market; |
| | short-term trading, defined as selling Standex stock within six months of purchasing Standex stock on the open market;►
| short sales; |
| | u► | buying or selling put or call options, or other derivative securities; |
| u | | buying or selling put or call options, or other derivative securities;
|
| u | | hedging transactions, such as zero-cost collars and forward sale contracts; |
| | u► | holding Standex stock in a margin account; or |
| | holding►
| pledging Standex stock in a margin account; oras collateral. |
| u | | pledging Standex stock as collateral.
|
For information regarding our Named Executive Officers’ compliance with such policies, refer to “Policy Concerning Transactions Involving Company Securities (Anti-Hedging Policy & Anti-Pledging Policy)” on page 6050of the Compensation Discussion and Analysis. VIEW THE COMPANY’S GOVERNANCE MATERIALS
You can view the Company’s governance materials, including the Certificate of Incorporation, By-Laws, Corporate Governance Guidelines and Board committee charters on the Company’s website, ir.standex.com, by clicking on “Governance” and then selecting the specific Company material. Instructions on how to obtain copies of these materials are included on page 75.Shareholder Engagement
COMMUNICATEWITHTHE BOARD
The Board has established a process to facilitate communication by shareholders and other interested parties with directors. Communications can be addressed to directors by emailing boardofdirectors@standex.com, or by writing to: Standex International Corporation 23 Keewaydin Drive, Suite 300 Salem, New Hampshire 03079 Attention: Corporate Governance Officer Communications with the Board are distributed by the Corporate Governance Officer. At the direction of the Board, all mail received may be opened and screened for security purposes. The Corporate Governance Officer uses his or her discretion in determining whether to forward communications to the Board. Communications that are unrelated to the duties and responsibilities of the Board will not be distributed. Such items include, but are not limited to: ► | spamjunk mail and mass mailings
|
u | ► | junk mailproduct complaints or inquiries
|
► | resumes and mass mailingsother forms of job inquiries |
u | ► | product complaintssurveys
|
► | business solicitations or inquiriesadvertisements |
u | | resumes and other forms of job inquiries
|
u | | business solicitations or advertisements
|
In addition, material that is trivial, obscene, unduly hostile, threatening or illegal or similarly unsuitable items will be excluded; however, any communication that is excluded will be made available to any independent, non-employee director upon request. View The Company’s Governance Materials You can view the Company’s governance materials, including the Certificate of Incorporation, By-Laws, Corporate Governance Guidelines and Board committee charters on the Company’s website, ir.standex.com, by clicking on “Governance” and then selecting the specific Company material. Instructions on how to obtain copies of these materials are included on page 71. | Director Compensation | | | 2021 PROXY STATEMENT | | | 41 | |
DIRECTOR COMPENSATION
The compensation elements and amounts are established by the Board after a review of data prepared by the Compensation Committee’s independent compensation consultant. The data and report show competitive director compensation levels for peer companies and the Company’s peer group. More information about the Compensation Committee’s independent consultant report and the methods for determining competitive compensation can be found under “Basis for Determining Executive Compensation” on page 6251. In FY 2021,2022, the Compensation Committee undertook a review of the compensation paid to our non-employee directors relative to the Company’s peer group. Based on this review,As the Committee determined that no changes were warranted fortypically reviews director compensation every two years, it did not perform a review in FY 2021.2023. However, with the formation of the I&T Committee, the Compensation Committee did establish the I&T member fees. | | | DIRECTOR COMPENSATION ELEMENTS
The FY 2021 compensation elements are shown in the adjacent table.
Directors may choose to defer up to 100% of their annual cash retainer into the MSPP, which is described in detail under “Management Stock Purchase Plan” on page 54. The equity portion of non-employee director compensation is granted in the form of shares of restricted stock having a $105,000 fair market value at the time of grant, which is established using the closing price of the Company’s stock on the date of the Annual Meeting. These shares of restricted stock vest 3 years after the grant date, are considered beneficially owned by the director and accrue dividend equivalents. Upon the retirement of a director or a change in control of the Company, all unvested shares of restricted stock are subject to acceleration and immediate vesting.
Directors do not receive fees for attending Board or committee meetings. Directors also do not receive benefits under Standex retirement plans or any perquisites.
Under the Company’s Corporate Governance Guidelines, all non-employee
DIRECTOR COMPENSATION ELEMENTS The FY 2023 compensation elements are shown in the adjacent table. Directors may choose to defer up to 100% of their annual cash retainer into the MSPP, which is described in detail under “Management Stock Purchase Plan” on page 44. The equity portion of non-employee director compensation was granted in the form of shares of restricted stock having a $120,000 fair market value at the time of grant, which was established using the closing price of the Company’s stock on the date of the annual meeting. These shares of restricted stock vest 3 years after the grant date, are considered beneficially owned by the director and accrue dividend equivalents, which are paid upon vesting. Upon the retirement of a director or a change in control of the Company, all unvested shares of restricted stock are subject to acceleration and immediate vesting. Directors do not receive fees for attending Board or committee meetings. Directors also do not receive benefits under Standex retirement plans or any perquisites. Under the Company’s Corporate Governance Guidelines, all non- employee directors are expected to accumulate shares of Company stock with a value of at least five times the value of their annual cash retainer. Until a director has the requisite number of shares, they are required to retain at least 50% of the share units they are awarded. As of June 30, 2023, all non-employee directors were in compliance with this requirement. Additionally, the Company has a policy concerning transactions involving Company securities. The policy is explained under “Anti-Hedging and Anti-Pledging Policies” on page 31. None of the directors have engaged in any of the prohibited transactions during FY 2023 or any prior periods. | FY 2023 Non-Employee Director Compensation | | | | | | | | | Compensation Element | | Value | | Board Membership | | | | | Annual Cash Retainer | | $ | 70,000 | | Annual Equity Stock Grant | | $ | 120,000 | | Committee Chair Fees | | | | | Audit Chair | | $ | 20,000 | | Compensation Chair | | $ | 15,000 | | N&CG Chair | | $ | 10,000 | | I&T Chair | | $ | 15,000 | | Committee Non-Chair Fees | | | | | Audit Non-Chair | | $ | 10,000 | | Compensation Non-Chair | | $ | 7,500 | | N&CG Non-Chair | | $ | 5,000 | | I&T Non-Chair | | $ | 7,500 | | Lead Independent Director | | $ | 25,000 | |
| Highlights of Director Compensation Program |
| ► | Emphasis on equity: ties the majority of director compensation to shareholder interests through stock grants. | | ► | Long term focus: equity grants vest after three years incentivizing directors to focus on the long-term. | | ► | Market competitive: adjustments to director compensation are based on peer group median levels and the work required of directors serving a diverse company such as ours. | | ► | Anti-hedging and anti-pledging: includes features that prohibit certain transactions involving our Company’s stock. | | ► | Stock ownership requirements: all directors must maintain equity ownership levels of at least five times the annual cash retainer and are required to retain at least 50% of the share unitsstock they are awarded. Asawarded until they reach the requisite number of June 30, 2021, all non-employee directors were in compliance with this requirement. Additionally, the Company has a policy concerning transactions involving Company securities. The policy is explained undershares. |
32 “Anti-Hedging and Anti-Pledging Policies” on page 41. None of the directors have engaged in any of the prohibited transactions during FY 2021 or any prior periods.2023 Proxy Statement | | 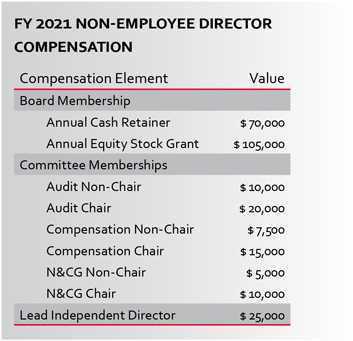
|
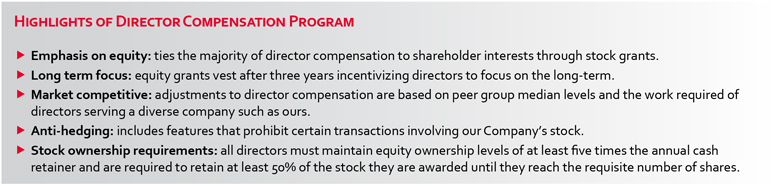
DIRECTOR COMPENSATION TABLE
The following table sets forth certain information with respect to our non-employee director compensation for FY 2021.2023. Compensation information for Mr. Dunbar is detailed in the Compensation Discussion & Analysis and Compensation Tables sections of this Proxy Statement. Mr. Dunbar did not receive any compensation solely for his service as a director. | Name | | Fees Earned or
Paid in Cash ($) 1 | | | Stock Awards
($) 2 | | | All Other
Compensation ($) 3 | | | Total ($) | | | Fees Earned or
Paid in Cash ($) 1 | | Stock Awards
($) 2 | | All Other
Compensation ($)3 | | Total ($) | | Charles H. Cannon, Jr. | | | 87,500 | | | | 105,000 | | | | 2,285 | | | | 194,785 | | | 86,250 | | | 120,000 | | | 4,104 | | | 210,354 | | Thomas E. Chorman | | | 97,500 | | | | 105,000 | | | | 2,285 | | | | 204,785 | | | 102,500 | | | 120,000 | | | 4,104 | | | 226,604 | | Robin J. Davenport | | | 91,250 | | | 120,000 | | | - | | | 211,250 | | B. Joanne Edwards | | | 60,500 | | | | 142,490 | | | | - | | | | 202,990 | | | 82,500 | | | 120,000 | | | 4,104 | | | 206,604 | | Jeffrey S. Edwards | | | 90,000 | | | | 105,000 | | | | 3,878 | | | | 198,878 | | | 84,375 | | | 120,000 | | | 4,104 | | | 208,479 | | Thomas J. Hansen | | | 45,000 | | | | 212,113 | | | | 4,409 | | | | 261,522 | | | 37,500 | | | 224,584 | | | 7,476 | | | 269,560 | | Michael A. Hickey | | | 87,500 | | | | 105,000 | | | | 2,285 | | | | 194,785 | | | 96,250 | | | 120,000 | | | 7,476 | | | 223,726 | |
| | 1 | This column includes the annual cash retainer and fees earned for serving as Lead Independent Director, Chair or member of any committee, less the portion of the annual cash retainer and fees earned for serving as Lead Independent Director, Chair or member of any committee less the portion of the annual cash retainer that the director elected to defer pursuant to the MSPP. |
| | 2 | This column includes the aggregate grant date fair value of the annual equity stock grant and the RSUs granted under a director’s deferment election under the MSPP. The annual equity stock grants were made on October 20, 2020,25, 2022, valued at $63.19$92.60 per share, the closing price of our common stock on the grant date. The MSPP RSU grants were certified on August 17, 202115, 2023 and granted on August 23, 2021,2023, valued at $71.18$106.10 per share, the closing price of our common stock on June 30, 20212023 discounted by 25% under the terms of the MSPP. Totals have been calculated in accordance with FASB ASC 718. |
| | 3 | This column consists of dividendsdividend equivalents that were paid in FY 2021 which2023 that had accrued during the 3-year vesting period for the director’s previous stock awards. |
| | As of June 30, 2021,
As of June 30, 2023, the aggregate number of unvested shares or share units held by each director was as follows: |
| Name | | Unvested Stock (#) | | | Name | | Unvested Stock (#) | | | Unvested Stock (#) | | Name | | Unvested Stock (#) | | Charles H. Cannon, Jr. | | | 4,121 | | | | | Thomas E. Chorman | | | 4,121 | | | 4,074 | | Thomas E. Chorman | | 4,074 | | B. Joanne Edwards | | | 4,121 | | | | | Jeffrey S. Edwards | | | 4,121 | | | Thomas J. Hansen | | | 7,655 | | | | | Michael A. Hickey | | | 7,261 | | | Robin J. Davenport | | | 2,413 | | B. Joanne Edwards | | 4,807 | | Jeffrey S. Edwards | | | 4,074 | | Thomas J. Hansen | | 7,748 | | Michael A. Hickey | | | 5,651 | | | | | |
| | | | 2021 PROXY STATEMENT | | | 43 | |
DIRECTOR INDEPENDENCE & RELATED PARTY TRANSACTIONS
DIRECTOR INDEPENDENCE
Under our Corporate Governance Guidelines, the Board requires that at least a majority of directors either meet or exceed the independence requirements of the NYSE. These rules provide that, in order to be considered independent, each director or nominee does not have a material relationship with the Company, either directly or as a partner, shareholder, or officer of an organization that has a relationship with the Company. Furthermore, directors and nominees cannot have any prohibited relationships, such as certain employment relationships, with the Company, its independent auditorauditors or another organization that has an affiliated relationship with the Company. The Board undertakes an annual evaluation of director independence. At its meeting on July 21, 2021,27, 2023, the Board affirmatively determined that each member of the Board and each nominee, (other than David Dunbar, the Company’s President and CEO), meets the independence standards. In addition, all members of the Audit Committee satisfy the enhanced independence criteria required for members of audit committees, and all members of the Compensation Committee satisfy the enhanced independence criteria required for members of compensation committees. CERTAIN RELATIONSHIPSAND RELATED PARTY TRANSACTIONS
Any transaction between the Company and its directors, executive officers, beneficial owners, and their immediate family members, is monitored closely. Proposed transactions in excess of $120,000 must be disclosed to the CLO. Furthermore, in the event a transaction is completed without the CLO’s knowledge, the transaction must be disclosed in an annual questionnaire that is completed and submitted to the CLO. During the past fiscal year and all prior periods, there have not been any such related party transactions.
Additionally, the Code of Conduct requires that all directors, executive officers and employees avoid engaging in any activity that might create a conflict of interest. All individuals are required to report any proposed transaction that might reasonably be perceived as creating a conflict of interest to their supervisor and/or the CLO. During the past fiscal year and for all prior periods, there have not been any reports of such transactions. During FY 2022, an annual certification process will be in place for all employees at management-or-above level to certify to the lack of a conflict of interest.Share Ownership
Delinquent Section 16(a) Reports
SHARE OWNERSHIP
DELINQUENT SECTION 16(A) REPORTS
Section 16(a) of the Securities Exchange Act of 1934 (the “Exchange Act”) requires Standex directors, executive officers and other persons who beneficially own more than 10 %10% of our common stock, to file reports with the SEC regarding their initial stock ownership and any changes in their stock ownership. Based solely on a review of the reports filed for FY 20212023 and related written representations, we believe that all of our executive officers and directors filed the required reports on a timely basis under Section 16(a), with the exception ofexcept for a Form 4 filing for Mr. Cannon’s Form 5 filing. Mr. Cannon reallocated shares between his direct ownership account and his family trust account and the CompanyValashinas, which was inadvertently not notified within the requisite time period, causing his filingdelayed by one day due to be late.an internal process error. DIRECTORDirector & MANAGEMENT STOCK OWNERSHIPManagement Stock Ownership
The following table shows, as of July 31, 2021,2023, the number of shares of our common stock beneficially owned by each of our current directors, director nominees and Named Executive Officers (except Mr. Burns and Mr. Maschera), and all directors and executive officers as a group. | | Name of Beneficial Owner | | Common Stock Beneficially Owned 1 | | Percent of Outstanding Shares | Common Stock Beneficially Owned 1 | Percent of Outstanding Shares | | Paul C. Burns | | 16,998 | | * | | | Annemarie Bell | | 7,542 | * | Charles H. Cannon, Jr. 2 | | 27,151 | | * | 20,286 | * | | Thomas E. Chorman | | 12,766 | | * | 11,950 | * | | Robin J. Davenport | | - | | * | 2,413 | * | | David Dunbar 3 | | 99,596 | | * | 161,962 | 1.37% | | B. Joanne Edwards | | 4,121 | | * | 6,534 | * | | Jeffrey S. Edwards | | 9,732 | | * | 12,145 | * | | Alan J. Glass | | 14,504 | | * | | | Alan Glass | | 25,881 | * | Thomas J. Hansen | | 8,715 | | * | 12,662 | * | | Michael A. Hickey | | 5,073 | | * | 10,626 | * | | James Hooven | | 4,949 | | * | | | Ademir Sarcevic | | 15,148 | | * | 26,880 | * | | Sean Valashinas | | 9,201 | * | All Directors & Executive Officers 4 | | 232,032 | | 1.87% | 310,551 | 2.63% |
| | * | Less than 1% of outstanding common stock |
| | 1 | “Beneficially Owned” means having the sole or shared power to vote, and/or the sole or shared power to invest the shares of common stock. The column contains stock which is, as of July 31, 2021,2023, beneficially owned by the director or executive. The column also includes shares of restricted stock units and performance share units that will be converted to common stock within 60 days: Burns (1,254)Bell (3,111), Dunbar (9,410)(72,168), Glass (1,824)(10,801), Sarcevic (17,160), Valashinas (3,369), Hansen (786)(1,577), Hickey (392)(1,577) and all other directors and executive officers (312)(2,468). |
| | 2 | Mr. Cannon has 23,02913,751 shares held in a trust, of which he is the trustee, for the benefit of Mr. Cannon’s children. |
| 3 | Mr. Dunbar has 67,233 shares held in a revocable trust, of which he is the trustee, for the benefit of Mr. Cannon’s children.his immediate family members. |
| | 3 | Mr. Dunbar has 36,637 shares held in a revocable trust, of which he is the trustee, for the benefit of his immediate family members.4
|
| 4 | This total includes shares beneficially owned by fourtwo additional corporate executive officers that are not NEOs. |
| | | | | | | | | 342023 Proxy Statement | | | | 2021 PROXY STATEMENT | | | 45 | |
Stock Ownership of Certain Beneficial Owners
STOCK OWNERSHIPOF CERTAIN BENEFICIAL OWNERS
Based on the most recent Schedule 13G filings, the following table sets forth information about the number of shares of our common stock held by persons we know to be the beneficial owners, as determined in accordance with Rule 13d-3 of the Exchange Act, of more than 5 %5% of the Company’s issued and outstanding common stock. | | | | | Name and Address | | Common Stock Beneficially Owned 1 | | Percent of Outstanding Shares as of the Dates Specified in their Respective Filings | BlackRock Inc. 2 | | | | | 55 East 52nd Street | | 1,889,620 | | 15.3% | NewYork, NewYork 10055 | | | | | The Vanguard Group 3 | | | | | 100 Vanguard Blvd. | | 1,244,643 | | 10.05% | Malvern, Pennsylvania 19355 | | | | | Champlain Investment Partners, LLC 4 | | | | | 180 Battery Street | | 812,330 | | 5.19% | Burlington, Vermont 05401 | | | | | Silvercrest Asset Management Group LLC 5 | | | | | 1330 Avenue of the Americas, 38th floor | | 635,295 | | 5.1% | NewYork, NewYork 10019 | | | | | Dimensional Fund Advisors LP 6 | | | | | 6300 Bee Cave Road, Building One | | 631,855 | | 5.1% | Austin, Texas 78746 | | | | |
| Name and Address | Common Stock Beneficially Owned 1 | Percent of Outstanding Shares as of the Dates Specified in their Respective Filings | | BlackRock Inc. 2 | | | | 55 East 52nd Street | 1,967,807 | 16.4 % | | New York, New York 10055 | | | The Vanguard Group 3 100 Vanguard Blvd. Malvern, Pennsylvania 19355 | 1,425,988 | 11.9 % | Copeland Capital Management, LLC 4 161 Washington Street, Suite 1325 Conshohocken, Pennsylvania 19428 | 612,878 | 5.1 % | Champlain Investment Partners, LLC 5 180 Battery Street Burlington, Vermont 05401 | 603,791 | 5.04 % |
| | 1 | This column shows shares beneficially owned by the named owner as follows: |
| | | | BlackRock | | | Vanguard | | | Champlain | | | Silvercrest | | | Dimensional | | BlackRock | Vanguard | Copeland | Champlain | Sole voting power | | | 1,868,988 | | | | - | | | | 494,110 | | | | 635,295 | | | | 602,925 | | 1,932,838 | - | 431,373 | 461,366 | Shared voting power | | | - | | | | 12,330 | | | | - | | | | - | | | | - | | - | 8,247 | 90,455 | - | Sole investment power | | | 1,889,620 | | | | 1,221,350 | | | | 642,670 | | | | 635,295 | | | | 631,855 | | 1,967,807 | 1,406,482 | 612,878 | 603,791 | Shared investment power | | | - | | | | 23,293 | | | | - | | | | - | | | | - | | - | 19,506 | - | - |
| | 2 | Information on BlackRock is based on a Schedule 13G/A filed by BlackRock on January 26, 2021.23, 2023. |
| | 3 | Information on Vanguard is based on a Schedule 13G/A filed by Vanguard on February 10, 2021.9, 2023. |
| | 4 | Information on Copeland is based on a Schedule 13G filed by Copeland on January 12, 2023. |
| 5 | Information on Champlain is based on a Schedule 13G/A filed by Champlain on February 11, 2021.13, 2023. |
| | 5 | Information on Silvercrest is based on a Schedule 13G filed by Silvercrest on February 16, 2021.
2023 Proxy Statement35 |
| 6 | Information on Dimensional is based on a Schedule 13G filed by Dimensional on February 16, 2021.
|
Compensation Discussion & Analysis
COMPENSATION DISCUSSION & ANALYSIS
The following sections contain our Compensation Discussion and Analysis. This CD&A provides an overview and analysis of our executive compensation program and policies and the material compensation decisions we have made for our chief executive officer, chief financial officer and our other executive officers named in the “Summary Compensation Table” starting on page 6454. This group is collectively referred to as our “Named Executive Officers” or “NEOs.” During FY 2021,2023, our NEOs were: | | u► | David Dunbar, President and Chief Executive Officer (“CEO”); |
| | David Dunbar, President and Chief Executive Officer (“CEO”);►
|
| u | | Ademir Sarcevic, Vice President, Chief Financial Officer (“CFO”) and Treasurer; |
| ► | Alan Glass, Vice President, Chief FinancialLegal Officer (“CFO”CLO”) and Treasurer;Secretary; |
| | u► | Annemarie Bell, Chief Human Resources Officer (“CHRO”); |
| | Alan J. Glass,►
| Sean Valashinas, Vice President, Chief LegalAccounting Officer (“CLO”CAO”) and Secretary;Assistant Treasurer; |
| | u | ► | Paul C. Burns, Vice President of Strategy and Business Development; and |
| u | | James Hooven,Former Vice President of OperationsStrategy and Supply Chain.Business Development; and
|
| ► | Flavio Maschera, Former Vice President, Chief Innovation and Technology Officer (“CITO”). |
As detailed in the Company’s Form 8-K filed on September 15, 2022, Mr. Sarcevic joinedBurns notified the Company on September 9, 2019. Mr. Hooven joinedthat he will be leaving the Company to pursue an alternative career opportunity. Mr. Burns committed to facilitate completion of certain projects and to ensure a smooth transition of his responsibilities. Mr. Burns’ employment with Standex ultimately terminated on February 17, 2020.
BUSINESS HIGHLIGHTSMarch 24, 2023.
We startedAs detailed in the Company’s Form 8-K filed on April 5, 2023, Mr. Maschera’s employment with Standex terminated on March 30, 2023 in connection with a reorganization of the innovation and technology function.
Business Highlights
Our 2023 fiscal year built upon the momentum we had built in 2021 and 2022 as we continued our emergence as a growth oriented, industrial operating company with solid operational execution. As a result, despite continued inflationary headwinds, we ended the year with an uncertain economic outlook duenine consecutive quarters of record adjusted operating margins. Overall, net sales for FY 2023 of $741.0 million increased by $5.7 million or 0.8% when compared to the pandemic, but combinedprior year, and income from operations of $171.1 million increased by $82.8 million or 93.8%. After adjusting for a one-time gain on the divestiture of a business unit of $62.1 million, income from operations of $109.0 million reflected an increase of $20.7 million or 23.4%. Adjusting for loss of revenue associated with the divestiture, we realized organic growth of approximately 5.7%, as increases in our sales to fast growth markets that we serve, such as electric vehicles, 5G, smart grid, industrial automation, commercial space and defense, more than offset the slower economic recovery in Asia. The increase in operating income reflected the increase in organic sales, pricing actions and continued improvement in operational improvements and excellent execution, results strengthened quarter after quarter. As a result, we had a year that exceeded our original expectations. We closed with a fourth quarter that delivered the highest adjusted operating margin in the Company’s history, with record backlogs as we look to FY 2022.performance. Our GDP+ growth process resulted in a third consecutive year of record level of sales to new applications in Electronics a first-ever patent issued toand the introduction of new products in most of our Scientific business and growth of laneway sales from $53M to $55M. We were proud to play a direct role in supporting the vaccine rollout in the United States, as our Scientific business responded directly to the growth in demand for vaccine storage units. As a result, the Scientific segment experienced record sales and earnings. Our robust balance sheet further strengthened during the yearremains robust as our increasing profitability and focus on improving working capital turns helped deliver free cash flow of over 100% of net income. Wewe ended the fiscal year with a net cash position with a net debt (cash) to EBITDA ratio of 0.57 (as defined under our revolving credit facility)(0.2) and an available borrowing capacity of approximately $250$372 million. Net salesWith an acceleration of $656.2 million represented an 8.6 % increase overongoing growth and development projects across the prior year, while income from operations decreased by 2.3 % to $59.2 million. After adjusting for a $14.6 million loss associated with the sale of an Engineering Technologies product line, income from operations was $73.8 million, an increase of 22.0 %. We closeCompany, we closed the year optimistic about FY 2022, with new development projects underway, and a renewed focus on organic growth in across the corporation. 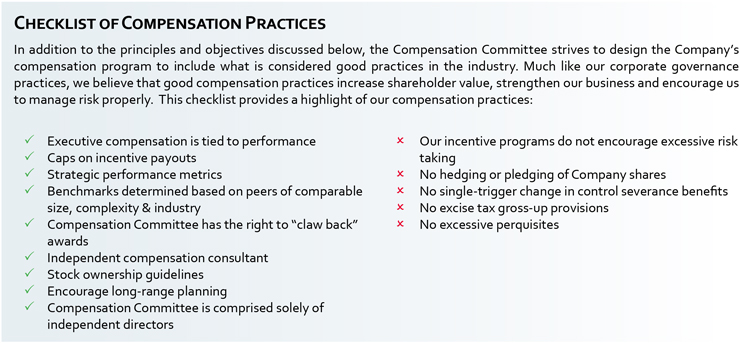
2024.
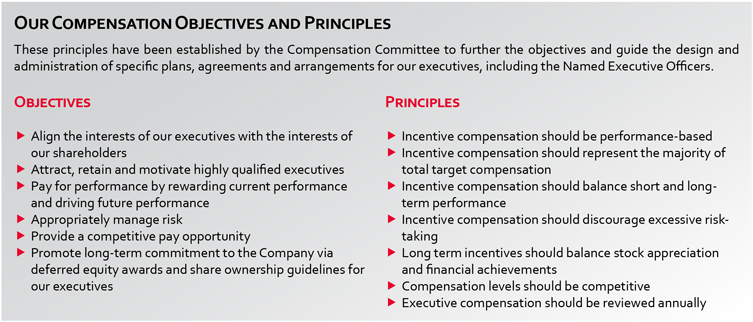
OBJECTIVESAND PRINCIPLES
Our Compensation Objectives and Principles | | | | | | | These principles have been established by the Compensation Committee to further the objectives and guide the design and administration of specific plans, agreements and arrangements for our executives, including the Named Executive Officers. | | | | | | Objectives | Principles | | | | | | ► | Align the interests of our executives with the interests of our shareholders | ► | Incentive compensation should be performance-based | | ► | Attract, retain and motivate highly qualified executives | ► | Incentive compensation should represent the majority of total target compensation | | ► | Pay for performance by rewarding current performance and driving future performance | ► | Incentive compensation should balance short and long- term performance | | ► | Appropriately manage risk | ► | Incentive compensation should discourage excessive risk- taking | | ► | Provide a competitive pay opportunity | ► | Long term incentives should balance stock price appreciation and financial achievements | | ► | Promote long-term commitment to the Company via deferred equity awards and share ownership guidelines for our executives | ► | Compensation levels should be competitive | | | ► | Executive compensation should be reviewed annually |
INCENTIVE COMPENSATION SHOULD BE PERFORMANCE-BASEDObjectives and Principles
Incentive Compensation Should Be Performance-Based The Compensation Committee believes that a significant portion of the compensation received by executives, including our Named Executive Officers, should be tied to the performance of the Company relative to established financial objectives and to individual strategic metrics. The elements of the executive compensation program embody this principle by linking the annual incentive opportunity and long-term equity grants directly to such performance. On an annual basis, the Compensation Committee reviews an independent report, provided by the external compensation consultant, on realizable pay for performance to ensure that our executives’ realizable pay is in line with overall Company performance and is also competitive when compared to the Company’s peer group. | | | | | | | | | | | | | INCENTIVE COMPENSATION SHOULD REPRESENTTHE MAJORITYOF TOTAL TARGET COMPENSATION | | | | | | | | | | | | | | | | | The Compensation Committee believes that the majority of an executive’s compensation should be “at risk,” as an incentive to drive the creation of sustainable shareholder value and align the interests of our executives with those of our shareholders. In 2021, our Named Executive Officers’ incentive compensation amounted to 65% of their total target compensation, on average. The Committee believes that the CEO’s incentive compensation should be a higher percentage of total compensation given the CEO’s strategic position and responsibility to drive company performance. In 2021,
Incentive Compensation Should Represent the Majority of Total Target Compensation The Compensation Committee believes that the majority of an executive’s compensation should be “at risk,” as an incentive to drive the creation of sustainable shareholder value and align the interests of our executives with those of our shareholders. In FY 2023, our Named Executive Officers’ incentive compensation amounted to 61% of their total target compensation, on average. The Committee believes that the CEO’s incentive compensation should be a higher percentage of total compensation given the CEO’s strategic position and responsibility to drive company performance. In FY 2023, the CEO’s incentive compensation was 80% of his total target compensation. The adjacent table presents the percentage of total target compensation that was “at-risk” for each Named Executive Officer, and the graph represents the mix of the Named Executive Officers’ total target compensation. The below table presents the percentage of total target compensation that was “at-risk” for each Named Executive Officer. Name | | | | | | | Name | | |
| Percent of FY 20212023 Pay
“At “At Risk” (%) |
| David Dunbar | | | 80.2 | % | | David Dunbar
| Ademir Sarcevic | | | 79.7%
68.3 | % | | | | | | | Ademir Sarcevic
| Alan Glass | | | 70.0%
60.8 | % | | | | | | | Alan J. Glass
| Annemarie Bell | | | 62.6%
55.6 | % | | | | | | | Paul C. Burns
| Sean Valashinas | | | 62.6%
42.9 | % | | | | | | | James Hooven
| Paul Burns | | | 50.3%
60.8 | % | | | | | | | | | | | | | | | | | | | | | | | | | | | | | | | | | | | | |
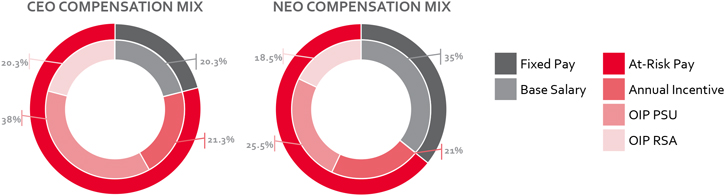
| | | | | 48 | | 2021 PROXY STATEMENTFlavio Maschera
| | | 55.6 | % |
Incentive Compensation Should Balance Short-Term and Long-Term PerformanceINCENTIVE COMPENSATION SHOULD BALANCE SHORT-TERMAND LONG-TERM PERFORMANCE
The Compensation Committee believes that driving sustained shareholder value creation requires that executive incentive compensation be appropriately balanced between short and long-term objectives. In addition, the Compensation Committee believes that such balancing discourages excessive risk taking that otherwise could drive short-term results at the expense of sustained long-term performance. Our executive compensation program promotes this objective by balancing the long-term incentive components in the form of equity-based awards, such as restricted stock awards and contingent performance shares, with short-term annual cash incentive opportunities. The value of long-term incentive components is tied, in part, to our stock price, thereby aligning executives’ interests with those of shareholders. However, the Compensation Committee recognizes that our share price is an incomplete measure of Company performance in the short term, as other factors may significantly impact stock prices. Accordingly, the annual cash incentive opportunity component of executive compensation emphasizes current or short-term corporate performance and the realization of short-term defined business and financial objectives. The Compensation Committee has determined that the balance between annual cash incentive opportunities and long-term equity incentives encourages our Named Executive Officers to focus on creating short and long-term shareholder value, while fulfilling business objectives and strategic goals. LONG-TERM INCENTIVES SHOULD BALANCE STOCK PRICE APPRECIATIONAND BUSINESS/FINANCIAL-BASED ACHIEVEMENTSASWELLAS SHAREHOLDER RETURN RELATIVETO OTHER INDUSTRIAL MANUFACTURING COMPANIESLong-Term Incentives Should Balance Stock Price Appreciation and Business/Financial-Based Achievements as well as Shareholder Return Relative to Other Industrial Manufacturing Companies
Our FY 20212023 long-term incentive awards for NEOs other than the CEO are equally weighted between restricted stock awards and contingent performance shares. For our CEO, the FY 2023 mix is 40% weighted towards restricted stock awards and 60% weighted towards contingent performance shares. The restricted stock awards component will vest on a pro-rata basis over three years. The contingent performance shares vest at the end of a 3-year performance period based on achievement against pre-establishedpre- established financial performance criteria. With respect to FY 20212023 PSU awards, ultimate award payouts will be adjusted by a relative TSR measure over the 3-year performance period to reflect performance relative to other industrial companies in the S&P 600 Capital Goods Index. The Compensation Committee has determined that this long-term incentive mix appropriately encourages long-term equity ownership, promotes a balance between stock price appreciation and financial-based achievement, aligns the interests of our Named Executive Officers with shareholders and aids in retention of our Named Executive Officers. COMPENSATION LEVELS SHOULDBE COMPETITIVECompensation Levels Should be Competitive
The Compensation Committee reviews market compensation data compiled and prepared by the Compensation Committee’s independent executive compensation consultant to evaluate whether our executive compensation program is market competitive. The Compensation Committee uses this data to benchmark our executives’ base salary, annual incentive opportunities and long-term incentive compensation. Generally, the Compensation Committee then sets target compensation at approximately the market median. However, the Compensation Committee considers other relevant factors in setting each Named Executive Officer’s total target compensation, including the Named Executive Officer’s scope of responsibilities and duties, experience, tenure with the Company, and individual performance as well as competitive market data, Company performance and internal pay equity. As a result, the Compensation Committee may set a Named Executive Officer’s total target compensation or an individual component of total target compensation below or above market median. By taking into account market data and other relevant considerations, the Compensation Committee is able to set each Named Executive Officer’s compensation at an appropriate level that enables us to attract and retain the highly qualified executives necessary to drive long-term enhancement of shareholder value. THE EXECUTIVE COMPENSATION PROGRAM SHOULDBE REVIEWED ANNUALLYThe Executive Compensation Program Should be Reviewed Annually
The Compensation Committee believes that it is prudent to review and evaluate the executive compensation program annually in light of evolving market practices, regulatory requirements, the competitive market for executives and our executive compensation philosophy. This process is repeated in a structured manner annually. | | | | | | | | | 382023 Proxy Statement | | | | 2021 PROXY STATEMENT | | | 49 | |
COMPONENTSOF EXECUTIVE COMPENSATION
OVERVIEWComponents of Executive Compensation
Overview We provide three elements of total direct compensation: base salary, annual incentives and long-term incentives, which are described below. We also provide limited perquisites (see page 5949) and standard retirement and benefit plans (see page 5848). | CEO | Average Named Executive Officer | | | | | | | | | | Description | | | | | | CEO
| | | | Average Named
Executive Officer
| | | | Description
| | | | | | | | Base Salary | | | |  | | | |  | | | | Fixed cash compensation based on the market-competitivemarket- competitive value of the skills and knowledge required for each role. Reviewed and adjusted when appropriate to maintain market competitiveness. | | | | | | | | Annual
Incentive
| | | |  | | | | |  | | | | Designed to reward results in the priorfiscal year. Annual cash incentives based on: | Annual Incentive u
| ► | Achievement of Company financial metrics u
| | ► | Individual performance on pre-established strategic goals | | | | | | | | Long-Term
Incentives
| | | |  Long-Term Incentives | | | |  | | | | Forward-looking equity awards intended to motivate and reward potential to drive future growth and align the interests of NEOs and shareholders. Grants awarded in the form of restricted stock awards and performance share units. Current performance measures include:include the following metrics and payouts are subject to a relative TSR modifier: | | | | ► | ROIC |
Base Salary u Modified ROIC
|
BASE SALARY
Base salary is fixed cash compensation. During the first quarter of each fiscal year, the Compensation Committee reviews and establishes the base salaries of theCompany executives, including the Named Executive Officers. For each Named Executive Officer, the Compensation Committee takes into account a number of factors, including the scope of the executive’s responsibilities and duties, experience, tenure with the Company, and individual performance as well as competitive market data, Company performance and internal pay equity. The Compensation Committee does not assign any relative or specific weights to these factors. Salary levels are reviewed annually and are adjusted when appropriate. Increases in base salary are not automatic or guaranteed in order to promote a performance culture. Effective October 1st1st of FYs 20202022 and 2021,2023, the base salary of each Named Executive Officer was set as follows: | | | | | | | | | | | | | | Name | | FY 2021 Base ($) | | | FY 2020 Base ($) | | | Increase | | | | | | David Dunbar | | | 869,130 | | | | 852,088 | | | | 2% | | | | | | Ademir Sarcevic 1 | | | 439,900 | | | | 415,000 | | | | 6% | | | | | | Alan J. Glass | | | 367,710 | | | | 360,500 | | | | 2% | | | | | | Paul C. Burns | | | 367,710 | | | | 360,500 | | | | 2% | | | | | | James Hooven | | | 336,600 | | | | 330,000 | | | | 2% | |
Name | FY 2023 Base ($) | FY 2022 Base ($) | Increase | David Dunbar | 900,419 | 869,130 | 3.6 % | Ademir Sarcevic | 469,408 | 453,097 | 3.6 % | Alan Glass | 392,376 | 378,741 | 3.6 % | Annemarie Bell 1 | 322,885 | 277,393 | 16.4 % | Sean Valashinas | 278,460 | 267,750 | 3.6 % | Paul Burns | 392,376 | 378,741 | 3.6 % | Flavio Maschera 2 | 384,681 | 371,314 | 3.6 % |
| | 1 | Ms. Bell received an above-market raise to bring her compensation in line with comparable positions in the Company’s peer group and due to her performance. |
| 2 | Mr. Sarcevic obtainedMaschera was paid in Euros, with an above-average increase inFY 2022 base salary due to his performance during the fiscal yearof €340,218 and to bring hisan FY 2023 base salary closerof €352,466. The dollar values disclosed here are based on the EUR to the medianUSD exchange rate of the peer group.1.0914 as of June 30, 2023. |
| | | | | 50 | | 2021 PROXY STATEMENT2023 Proxy Statement
39 | | |
Annual Incentive OpportunityANNUAL INCENTIVE OPPORTUNITY
The Compensation Committee establishes the annual cash incentive opportunity for executives including our Named Executive Officers through a detailed performance planning process called the Balanced Performance Plan (“BPP”). During the BPP process, the Compensation Committee establishes (i) the target incentive amounts; (ii) the respective weight of the financial performance measures and strategic goals; (iii) the Company financial performance goals at “threshold,” “target,” and “superior” levels; and (iv) the strategic goals for each Named Executive Officer. The BPPsfinancial metrics and each strategic goal are reviewed and discussed during the course of two Compensation Committee meetings through the first quarter of each fiscal year before being approved. 2021 ANNUAL INCENTIVE FORMULA2023 Annual Incentive Formula
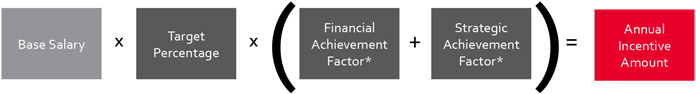
* These factors are calculated by taking the goal weight and multiplying it by the goal achievement percentage. For example, if the weight of financial goals totals 75%, and the financial achievement percentage is 100%, the financial achievement factor would be 75%; if the weight of financial goals totals 75% and the financial achievement percentage is 200%, the financial achievement factor would be 150%. TARGET INCENTIVE AMOUNTSTarget Incentive Amounts
Each year the Compensation Committee sets the target incentive amount for each Named Executive Officer, expressed as a percentage of the executive’s base salary. The Compensation Committee sets these target incentives based on a number of factors, including the Named Executive Officer’s role and responsibilities, internal pay equity and competitive market data, in consultation with the compensation consultant and in adherence to our stated executive compensation objectives and principles. The target annual incentive opportunity for each Named Executive Officer in FY 20212023 is as follows: | | Name | | Target Annual Incentive (% of Base Salary) | | | Target Annual Incentive Amount
($) | | Target Annual
Incentive (% of
Base Salary) | Target Annual
Incentive Amount
($) | | David Dunbar | | | 105% | | | | 912,587 | | 105 % | 945,440 | | Ademir Sarcevic | | | 65% | | | | 285,935 | | 65 % | 305,115 | | Alan J. Glass | | | 55% | | | | 202,241 | | | | Paul C. Burns | | | 55% | | | | 202,241 | | | | James Hooven | | | 45% | | | | 151,470 | | | Alan Glass | | 55 % | 215,807 | Annemarie Bell | | 55 % | 177,587 | Sean Valashinas | | 35 % | 97,461 | Paul Burns | | 55 % | 215,807 | Flavio Maschera 1 | | 55 % | 211,574 |
| 1 | Mr. Maschera’s target annual incentive amount was based on his FY 2023 base salary of €352,466 as converted from EUR to USD using the June 30, 2023 exchange rate of 1.0914. |
GOAL WEIGHTWITHIN TARGET INCENTIVEGoal Weight within Target Incentive
After establishing a target incentive amount for each executive, the Compensation Committee determines the relative weight of financial performance measures and strategic goals. For FY 2021,2023, the Compensation Committee set the following relative weight of these performance measures (except for Mr. Burns):measures: | | u► | 75% of the annual incentive opportunity would be based on the achievement of financial performance goals, and |
| | 75 %►
| 25% of the annual incentive opportunity would be based on theindividual achievement of financial performance goals, andstrategic goals. |
| u | | 25 % of the annual incentive opportunity would be based on individual achievement of strategic goals.
|
Payout for the achievement of both financial performance and strategic goals can range between 0% and 200%, where performance below threshold levels corresponds to a payout of 0%, while performance at or above superior levels corresponds to a payout of 200%. For example, if the weight of financial goals is 75%, the maximum financial achievement factor would be 150%. Similarly, if the weight of strategic goals is 25%, the maximum strategic achievement factor would be 50%. The combined factors are capped at 200%. With respect to Mr. Burns, the Compensation Committee determined that 50% of his annual incentive opportunity would be based on achievement of financial performance goals and 50% of his annual incentive opportunity would be based on strategic goals due to the nature of his position as head of the Company’s strategy and business development function.
Setting Financial Performance Measures
SETTING FINANCIAL PERFORMANCE MEASURES
The Compensation Committee, working with the CEO, evaluates and establishes financial objectives that correlate to the creation of shareholder value, are aligned with the Company’s annual business plan and are appropriate measures for evaluating executive performance. For FY 2021,2023, the Compensation Committee selected the following three financial performance measures: (i) EBITDA,adjusted Operating Income, (ii) adjusted EPS, and (iii) net working capital turns. The Compensation Committee selected these performance measures because it believes they are important financial factors in preserving and enhancing shareholder value in the short-term and sustaining growth and stability for the long-term. After determining the performance measures, the Compensation Committee sets “threshold,” “target,” and “superior” performance goals, which correspond to annual incentive payouts of 50%, 100% or 200% of the target incentive amount, respectively, exceptfor “threshold”“entry” for the EBITDAadjusted Operating Income performance measure corresponds to a payout of 25%. If actual performance falls between two performance levels, the amount of the incentive payout would be determined through interpolation. However, no payout would be made if actual performance falls below threshold.entry for the adjusted Operating Income performance measure or below threshold for all other measures. Additionally, if adjusted Operating Income performance exceeds target, the Compensation Committee set a requirement that the adjusted operating income margin must also be at least 12.7% for payout to exceed target. The Compensation Committee included this requirement in order to prevent margin dilution. The Compensation Committee sets the “entry” and “threshold” performance levellevels high enough so that achieving the level is not guaranteed, while setting the “superior” performance level high enough so that achieving it is difficult and represents an outstanding accomplishment. The Compensation Committee may adjust the financial performance targets to reflect the impact of special events, such as acquisitions or divestitures, during a fiscal year. These adjustments are made pursuant to established guidelines and are appropriate in light of long-term growth strategies and business operations. FINANCIAL GOALSFinancial Goals & RESULTSFORResults for FY 20212023
For FY 2021,2023, the financial performance metrics, weights, achieved performance levels and payout percentages were as follows: | | | | | | | | | | | | Financial Performance Metric | | Threshold Target Superior | | Weight | | Weighted
Achievement | | | | | Adjusted EBITDA 1 | |  | | 40% | | 80% | | | | | Adjusted EPS 2 | |  | | 5% | | 10% | | | | | Net Working Capital Turns Q1 3 | |  | | 6% | | 6% | | | | | Net Working Capital Turns Q2 | |  | | 6% | | 9% | | | | | Net Working Capital Turns Q3 | |  | | 6% | | 10.3% | | | | | Net Working Capital Turns Q4 | |  | | 6% | | 12% | | | | | Net Working Capital Turns 5 Point Average 4 | |  | | 6% | | 10.1% | | | | | | | Financial Goals Weighted Achievement Total | | 137.4% 5 |
Financial Performance Metric | Entry Threshold Target Superior | Weight | Weighted Achievement | | | | | | | Adjusted Operating Income 1 | | 40 % | 52.5 % | | | | | | | Adjusted EPS 2 | | 5 % | 7.2 % | | | | | | | Net Working Capital Turns Q1 3 | | 6 % | 0 % | | | | | | | Net Working Capital Turns Q2 | | 6 % | 0 % | | | | | | | Net Working Capital Turns Q3 | | 6 % | 0 % | | | | | | | Net Working Capital Turns Q4 | | 6 % | 0 % | | | | | | | Net Working Capital Turns 5-Point Average 4 | | 6 % | 0 % | | | | | | | | Financial Goals Weighted Achievement Total | 59.7 % |
| | 1 | Adjusted EBITDA, which stands for earnings before interest, tax, depreciation and amortization,Operating Income is a non-GAAP financial measure, that is determined by the sum of (i) income from continuing operations before income taxes, (ii) interest expense,which takes Operating Income and (iii) depreciation and amortization. This value, used for the purpose of determining the annual incentive opportunity, adjusts forexcludes restructuring charges, purchase accounting expenses, insurance recoveriesacquisition-related expenses and acquisition costs.other one-time items. The target value and actual value disclosed here also excludes income earned from the Procon business because it was a business managed for sale for the majority of the FY. |
| | 2 | This value, which is greaterless than the Company’s actual reported diluted earnings per share of $2.97$11.59 for FY 2021. This value, used for the purpose of determining the annual incentive opportunity,2023, adjusts for restructuring charges, purchase accounting expenses, insurance recoveries, discontinued operations, acquisition costs and any income tax impacts thereof, along with one-time tax adjustments. The value also excludes any earnings from the Procon business prior to its sale, as well as the gain on sale of the business. |
| | 3 | Net working capital turns measures the ratio of sales to net working capital. The ratio was calculated by using annualized net sales for the trailing three-months of the listed quarter and dividing by the net working capital (calculated as net accounts receivable and inventory minus accounts payable) at the end of the listed quarter, and dividing by the net working capital (calculated as net accounts receivable and inventory minus accounts payable) at the end of the listed quarter. |
| | 4 | This five-point average included the net working capital turns for Q1-Q4 of FY 20212023 and Q4 of FY 2020.2022. |
| 422023 Proxy Statement | | 5 | Mr. Burns’ financial goal weighted achievement total was 91.6% due to differing weight of financial vs. strategic goals.
|
Setting Strategic GoalsSETTING STRATEGIC GOALS
The Compensation Committee, in consultation with the Board, evaluates and establishes strategic objectives that correlate with the creation of shareholder value, align with the Company’s business plan and are appropriate measures for judging individual executive performance. As with financial performance measures, the Compensation Committee sets relative weights and metrics for each strategic goal. The specific goals are developed based on the individual nature of an executive’s role and responsibilities. In FY 2021,2023, the Compensation Committee set the following strategic goals for the CEO: | | u► | Using organic and inorganic actions, deploy the Company’s resources to position Standex to grow sales faster than the rate in our long-range plan; |
| | Improve growth management process►
| Apply the standard work of the Standex Growth Disciplines, OpEx, Talent Management and BPP across the entire Company to deliver sequential quarterly sales growth from $135M to $151M with organic growth from laneways; improve accountabilitycreate a high performance and financial management process to improve business forecasting; createscalable operating scorecards to support achievement of productivity targets; maintain TRIR below 0.7;model; |
| | u► | Divest non-core businesses to increase focus of remaining business where Standex can create the most shareholder value; acquire accretive strategic bolt-on acquisitions; and |
| | Attempt►
| Implement a robust sustainability and ESG strategy to close two or more strategic bolt-on acquisitions with IRR > 15%; initiate divestiture activity on at least one portfolio business; execute portfolio moves such that modified ROA of corporation improves over 3-5 year period;increase business resilience and help improve overall Company performance. |
|